Playable ads are no longer just nice to have in the creative mix. The latest report shows record-high performance, and the format is evolving quickly.
Fresh data from our partners at Apptica shows playables are crushing it with record performance scores of 191 (up from 164 last year). Performance scores quantify the effectiveness of different types of ads in driving key success outcomes such as app downloads and revenue growth. It means that if you’re not optimizing playables right now, you’re literally leaving money on the table.
This article provides a data-driven mid-year review of playable ads in 2025, highlighting their rising effectiveness, dominant channels, and evolving creative formats. It offers actionable insights on optimizing playable ad strategies, focusing on key markets, production approaches, and testing best practices. The piece is designed for mobile marketing strategists, user acquisition professionals, and marketing artists aiming to maximize campaign performance with interactive ads.
Let’s break down what actually matters this year:
1. MARKET OVERVIEW AND TRENDS
1.1. Network Dominance and Traffic Distribution
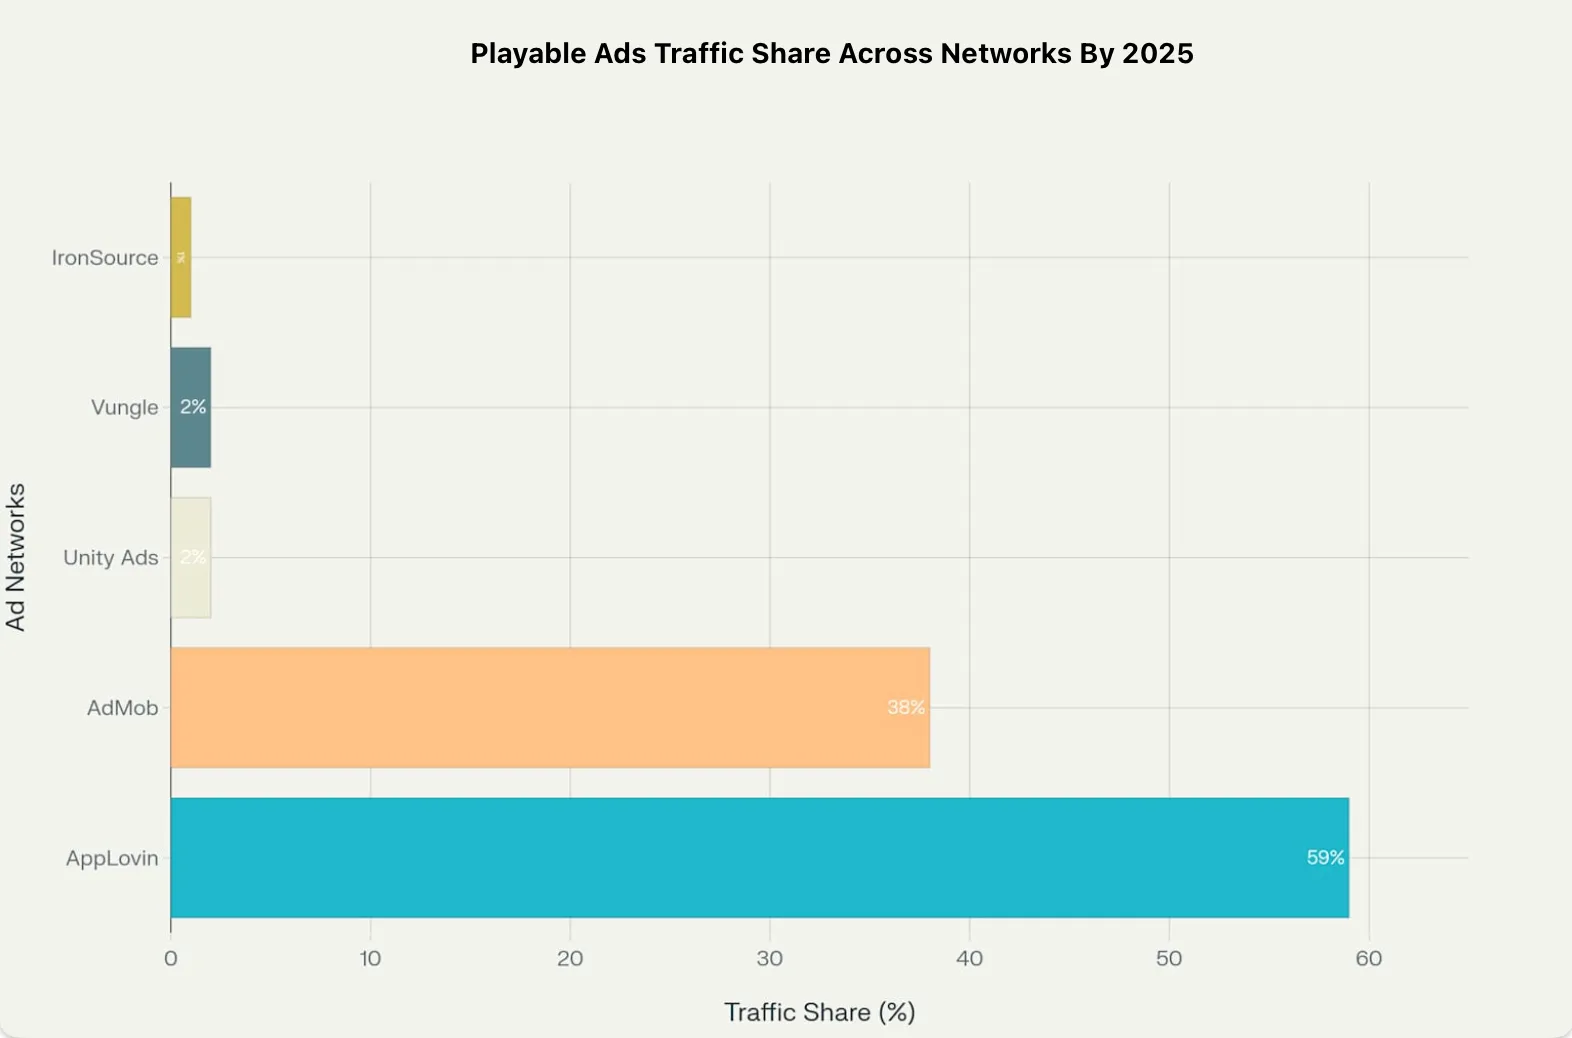
AppLovin’s takeover that can’t be ignored:
- They now control 59% of playable traffic (AdMob: 38%).
- 84% of new experiments happen on their platform.
If you are not testing here, you’re ignoring 6/10 potential players. This makes AppLovin a critical platform for scaling mobile game user acquisition due to its extensive reach and optimization capabilities, especially for driving high-quality installs through interactive ad formats.
1.2. Geographic Hotspots and Emerging Markets
North America still leads with 61% of global spend, but if we take a look closer:
- Europe follows with 18% of global spend.
- Asia surges to 16%.
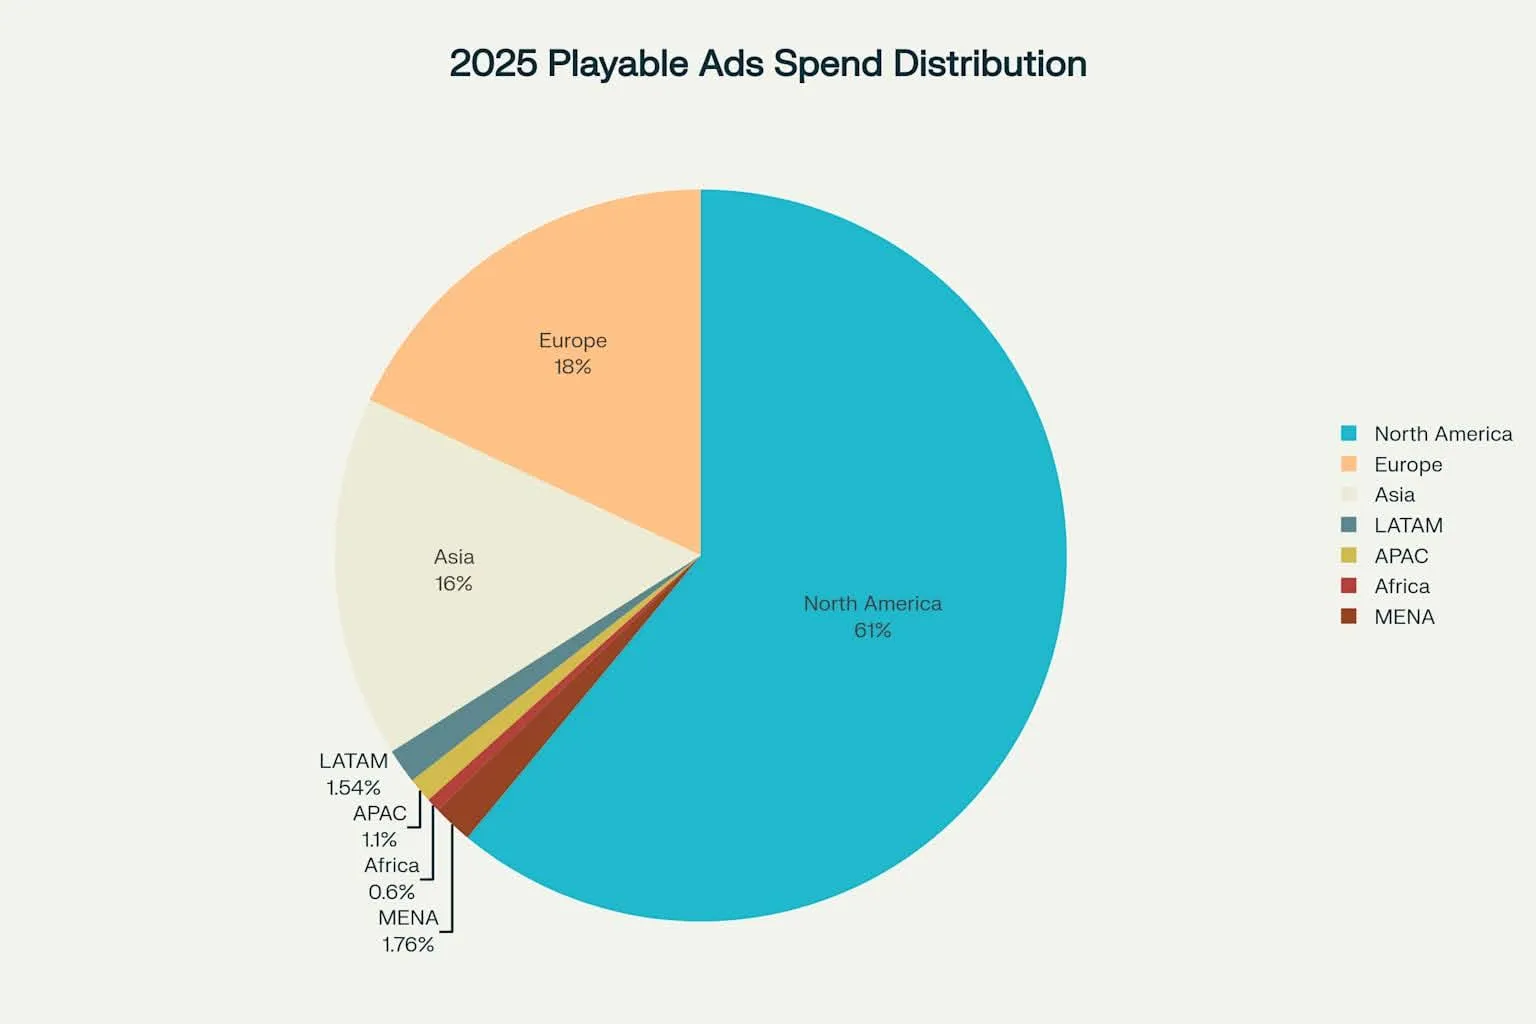
Note: The approximate spend above was derived by multiplying the impression volumes retrieved from Apptica by the average Ad Networks’ CPMs for the represented regions.
The regional breakdown reveals strategic opportunities that many advertisers are missing; Asia and Europe have significant potential after North America.
For mobile gaming companies, exploring these diverse markets can unlock new revenue streams and user bases, moving beyond saturated Tier 1 regions and optimizing your global user acquisition strategy.
1.3. Performance Recovery: The 2025 Surge
Following the financial turmoil experienced by most gaming studios in 2023 (score of 51), playable ads have not only recovered but also reached new heights.
The 2025 score of 191 represents a 16% increase from 2024’s 164, indicating that the format has matured significantly.
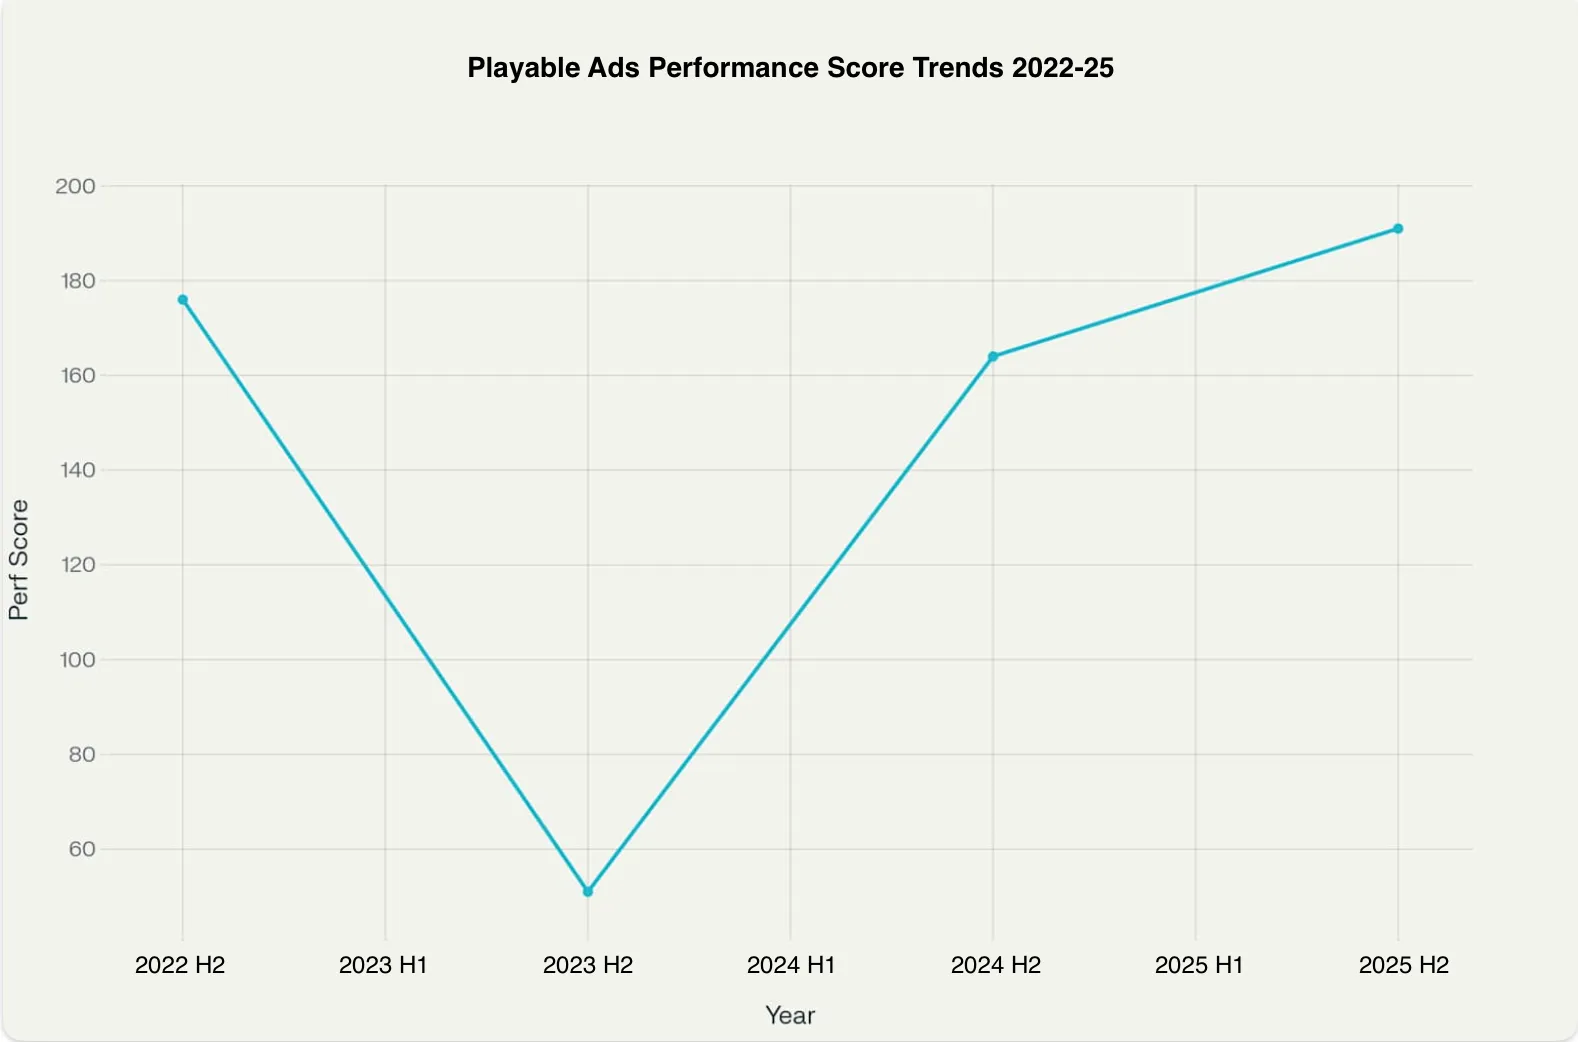
Annual performance scores showing playable ads recovery and growth, reaching the highest performance in 2025.
This recovery can be attributed to several factors:
- Better ads + smarter targeting.
- Evolution from “tap fakes” to actual mini-game experiences.
This resurgence solidifies playables as a critical format for effective mobile ad campaigns in 2025, proving their value for engaging users and driving app success metrics.
1.4. Emerging Formats and Creative Evolution
Moving From Basics
Playable ads have come a long way from their hypercasual roots. The days of single-tap, oversimplified interactions are fading fast, especially in key markets like Taiwan and the US.
What’s replacing them? Smarter, richer experiences with layered gameplay and decision-making that actually keep users engaged.
Here’s what’s trending now:
- Puzzle Hybrids: Word games and logic-based formats are booming, especially in India and China. These playables offer light mental challenges that feel rewarding without being overwhelming.
- Simulations: Think farming, driving, or managing a virtual life; these types of interactive demos are gaining traction for being intuitive yet deeply engaging.
- 4X Strategy Mechanics: Complex systems like base-building and resource management are now being streamlined into short, impactful playable ads. These more complex formats resonate well with core mobile gamers looking for deeper engagement and can drive higher-quality installs for diverse app genres.
1.5. Video-Playable Integration
There is a growing dominance of video-integrated playables. A staggering 92.5% of new creatives now include embedded video. Even more interesting: 82.5% of interactive playables start with a lead-in video, and 68.1% of those actually tie the video’s context directly to the gameplay.
The video sets the stage and hooks the user, while the interactive layer seals the deal. This integrated approach enhances the user experience and can lead to higher conversion rates by seamlessly transitioning users into the playable experience, a key best practice in mobile ad creatives.
2. THE ANATOMY OF SUCCESS
Opening Strategy: 49.7% of high-performers use opening scenes, with 65.3% leveraging edited snippets from lead-in videos rather than full video replays. This suggests a more strategic approach to capturing attention in the first few seconds.
Text Strategy: While 46.5% include text elements, the type matters significantly—88.4% use instructional text, while challenging (9.3%) and emotional (2.3%) text remain underutilized.
Instructional text guides users through the playable, improving completion rates and ensuring a clearer understanding of the game mechanics or app features.
Completion Strategy: Perhaps most surprisingly, 42.2% of top playables end in a complete state (win or fail), while 40% deliberately end mid-gameplay to create urgency. Among completed playables, 85.9% end in wins, supporting the “let players win” philosophy.
Emotional Strategy: Emotional appeal is a very common tactic in playable ads. These emotional cues can increase engagement by fostering urgency, curiosity, or satisfaction, making the experience feel more personal and memorable. For mobile gaming apps, eliciting emotions like excitement, accomplishment, or curiosity is crucial for driving engagement and subsequent installs, directly impacting user acquisition.
What High-Performing Playables Have in Common
We took a closer look at the best-performing playables across the board, and some clear patterns emerged:
- Tutorial Prompts & Logos: Present in 85.4% of successful ads. It’s all about clarity and brand recognition.
- Strong CTAs: Found in 55.1% of top playables. A well-placed “Try Now” or “Download” still makes a difference.
These elements don’t just look nice—they drive performance.
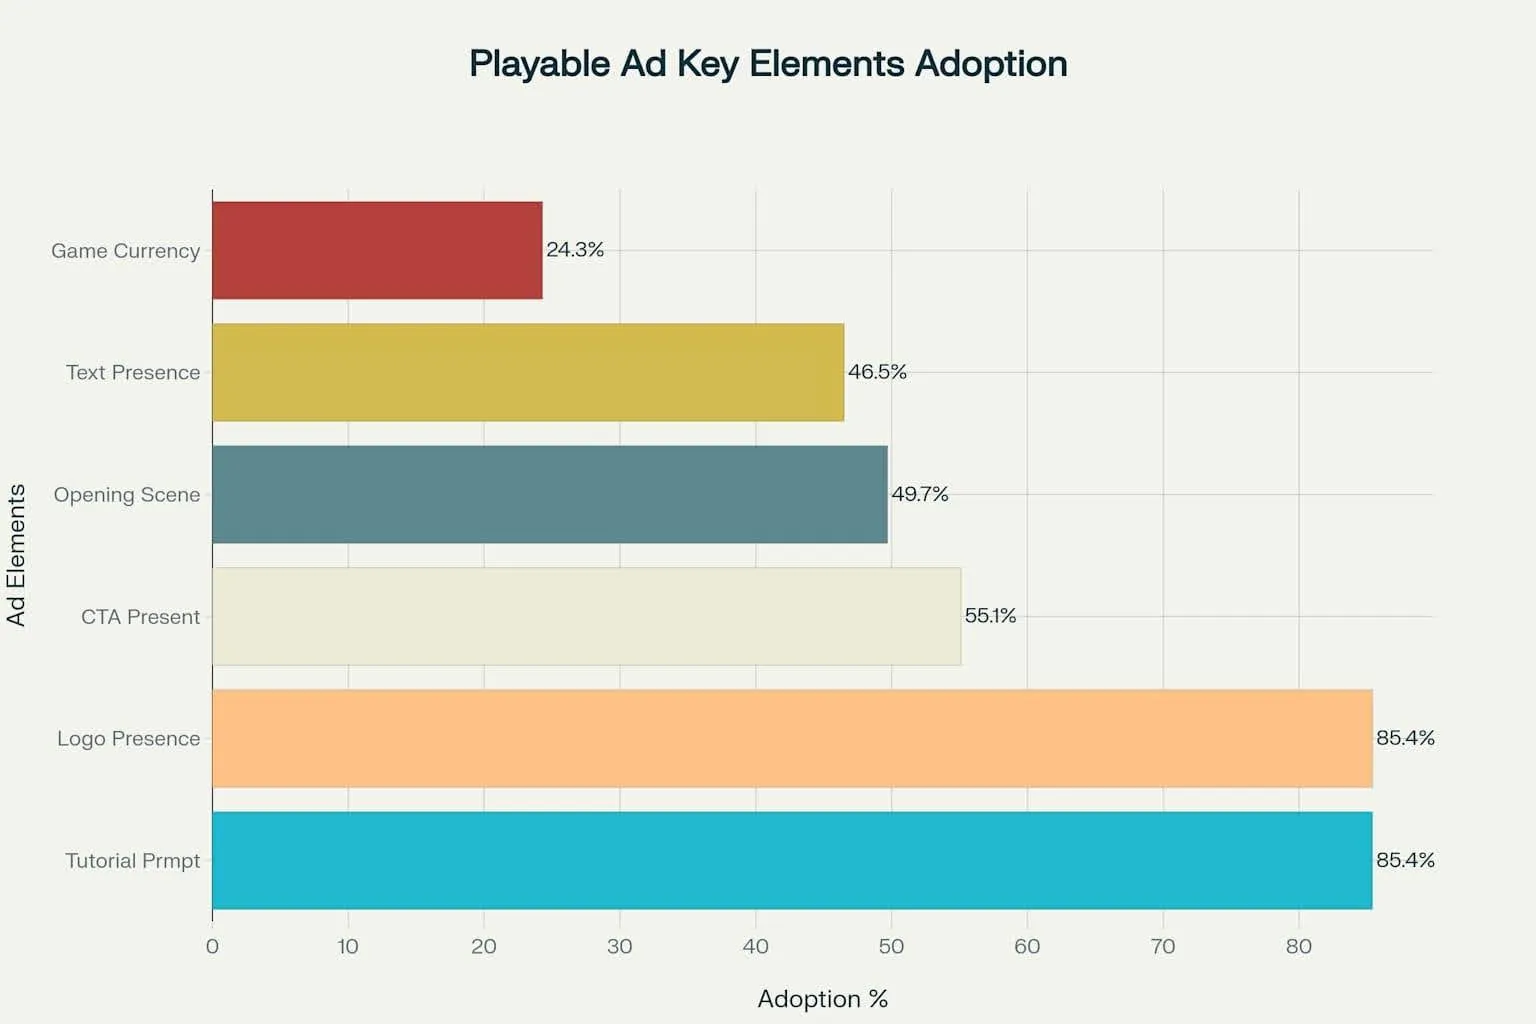
Adoption rates of key elements in playable ads showing tutorial prompts and logos as most common features.
2.1. Channel Strategy: Where to Invest Your Budget
Primary Channel Recommendations
Based on traffic share and performance data, your channel priority should be:
- AppLovin (59% traffic share): Best for testing new concepts and scaling proven winners
- AdMob (38% traffic share): Strong for Android-first campaigns and Google ecosystem integration
- Unity Ads (2% traffic share): Valuable for gaming-specific audiences despite lower volume
Diversifying across these networks can maximize reach and optimize playable ad spend by tapping into different user segments, crucial for a comprehensive mobile user acquisition strategy.
Geographic Targeting Strategy
- Tier 1 Markets: Japan and South Korea consistently deliver strong results across all playable mechanics, making them ideal for high-budget campaigns.
- Testing Markets: India offers the best balance of volume and cost-effectiveness for creative testing, while showing strong engagement with advanced mechanics.
- Emerging Opportunities: South Africa and the UAE represent underexplored markets with growing playable adoption.
Tailoring playable content to cultural nuances and regional preferences in these markets can significantly boost performance and lead to cost-effective user acquisition. (See our guide on how to best pick countries for your app launch for more on geographic targeting.)
2.2. Production Considerations: Build vs. Buy
The Economics of In-House Production
External playable production typically costs $3,000-$5,000 per creative with 2-4 week turnaround times.
Companies like Socialpoint have successfully moved production in-house, now producing 5-8 playables monthly across three games at significantly reduced cost.
In-House Benefits:
- Rapid iteration capability (days vs. weeks)
- Direct creative control and testing flexibility
- Cost reduction of 60-80% after initial setup investment
External Partner Benefits:
- Immediate access to specialized expertise
- No internal resource allocation required
- Established network compliance processes
The choice between in-house production and external partners often depends on the volume of creatives needed and long-term strategic goals for mobile ad campaigns and creative optimization.
Technical Requirements for Playable Ads
Whether building in-house or working with partners, ensure your production pipeline includes:
- Multi-network exporters: Each ad network has unique technical requirements
- Analytics integration: Track interaction points, dropout rates, and conversion funnels
- Asset optimization: Playables must fit within 5MB package limits
Adhering to these technical specifications is crucial for seamless ad delivery and accurate performance tracking across various platforms, impacting the overall efficiency of your mobile ad creatives.
2.3. Testing Framework: Measuring What Matters
Essential Metrics Beyond Install Rates
While CPIs for playables can be as low as $15 for a casual puzzle game, focus on these performance indicators:
Engagement Metrics
- Completion Rate: Percentage who finish the entire playable experience
- Time to Engage: How quickly users interact with the ad
- Number of Clicks: Number of clicks taken
Quality Metrics
- Day 7 ROAS: Playables deliver approximately 17% D7 ROAS for a casual puzzle game when optimized correctly
- Retention Correlation: Track how playable interaction time correlates with app retention
- Win vs. Loss CTR: Test whether players convert better after winning or losing
These metrics provide a holistic view of playable ad effectiveness, going beyond just initial installs to measure long-term user quality and campaign ROI. (For more on measuring ad performance, see our guide on How to read mobile ad creative performance data.)
2.4. A/B Testing Best Practices
Creative Variables to Test
- CTA placement and timing (persistent vs. end-only)
- Character selection based on game analytics data
- Difficulty tuning and win/loss scenarios
Statistical Requirements
- Minimum 50 conversions per creative in 4 days
- 100 conversions per creative in 7 days for reliable results
Rigorous A/B testing is crucial for continuous optimization of playable ad performance and maximizing return on ad spend. You can download our Creative Testing Guide for a detailed framework on how to test creatives.
2.5. Current Trends and Format Innovation
What’s Working Now (June 2025)
- Clickable End Cards: The most common new playable format across all networks features simple visuals with clear CTAs, no complex mechanics.
- Playable Only Versions: This is the rising trend among the big game companies lately.
- Video Hybrids: Combining eye-catching video footage with interactive overlays, showing 20-30% higher watch-through rates. Staying on top of the latest creative trends is key—here are some of the top blogs and newsletters on mobile app marketing we recommend following.
- Genre-Specific Adaptation: Match-3 puzzles and endless runner mechanics remain popular, but we’re seeing finance apps adopt budgeting simulators and fitness apps using goal-selection playables. For more cross-industry inspiration, explore these real-world mobile marketing examples that demonstrate how interactive formats are evolving beyond gaming.
Staying abreast of these trends is vital for creating high-performing playable ad creatives that capture user attention.
Declining Formats
- Over-Simplified Hypercasuals: One-tap, swipe-to-win formats are losing effectiveness due to low engagement depth.
- Traditional Puzzle Types: Classic match-3 mechanics are underperforming compared to 2024, despite continued market presence.
This indicates a clear shift towards more sophisticated and engaging interactive experiences for sustained mobile user acquisition.
2.6. Vertical-Specific Strategies
Gaming Verticals
Top Performing Genres (by success correlation):
- Puzzle games (leading both success and popularity lists)
- Tabletop and board games
- Block puzzle variations
- Match-3 (despite declining traditional formats)
Emerging Gaming Trends:
- RPG elements in casual games
- Merge mechanics with progression systems
- Wildlife and pet simulation themes
These trends highlight fertile ground for playable ad innovation and user acquisition within the mobile gaming sector, providing key insights for marketing artists and strategists.
Non-Gaming Applications
Playables are expanding beyond gaming, with finance, education, and e-commerce apps adopting interactive formats. Success in non-gaming verticals requires adapting game mechanics to showcase core app functionality rather than creating disconnected mini-games—see how these design principles for mobile marketing apps can guide that process. This diversification demonstrates the versatility and growing adoption of playable ad formats across various app categories, offering new avenues for mobile ad campaigns beyond traditional gaming.
That means that in the foreseeable future, we would be looking at the playable examples from both gaming and non-gaming worlds, as it can highlight the bigger trends in the industry and drive a more innovative creative strategy.
3. SUGGESTIONS FOR PRACTITIONERS
Immediate Actions (Next 30 Days)
- Audit Your Network Mix: If you’re not testing on AppLovin, you’re missing 59% of the market
- Implement Contextual Video Integration: Ensure your video leads naturally into your playable experience
- Add Tutorial Prompts: 85.4% of successful playables include guidance elements
Medium-Term Strategy (Next 90 Days)
- Develop Multi-Step Mechanics: Move beyond simple tap interactions to decision-based gameplay
- Test Asian Markets: Japan and South Korea offer the highest success rates for advanced mechanics
- Implement Advanced Analytics: Track interaction points and dropout rates for optimization
Long-Term Positioning (Next 12 Months)
- Consider In-House Production: For companies producing 5+ playables monthly, internal capabilities offer significant cost and speed advantages
- Expand to Non-Gaming Formats: Early adoption of playables in non-gaming verticals shows strong performance potential
These recommendations provide a clear roadmap for maximizing playable ad impact and achieving sustainable growth throughout the year, reinforcing best practices for mobile marketing strategies.
How AppAgent Can Supercharge Your Playable Ad Strategy
At AppAgent, we’ve been in long-term partnerships with marketing teams, helping them make sense of the fast-moving world of playable ads. With our hands-on creative strategy framework, we turn insights into action. The goal? Smarter campaigns that not only bring in users, but the right users.
For instance, one of our recently produced playable ads—featuring an engaging and intuitive proposal simulation game—demonstrated outstanding user engagement by seamlessly blending interactive storytelling with clear call-to-actions. This example highlights our ability to craft playables that not only capture attention but also drive deeper user interaction and conversion.
Explore more mobile marketing strategies on the AppAgent Blog for actionable tips and Case Studies.
What We Bring to the Table:
- Channel Strategy That Fits You
We tailor the channel mix to your vertical and target markets, making sure every dollar works harder. - Creative Concepts That Convert
From casual to midcore, we craft playable ideas using proven frameworks we’ve refined with some of the industry’s top publishers. (Explore our Mobile Ad Creatives Ebook for more on our approach to high-performing visuals.) - Deep-Dive Analytics
We implement advanced tracking to understand not just what users do—but why they convert. (Learn more about measuring campaign effectiveness in our blogs, How to Calculate Customer Acquisition Cost (CAC) for Mobile Apps and The principles of mobile ad attribution, analytics and tracking). - A Trusted Production Network
We connect you with trusted partners who specialize in high-impact playable production.
Whether you’re just starting with playables or fine-tuning a mature strategy, we bring the experience, tools, and creativity to help you win in 2025’s hyper-competitive market.
Playables are evolving fast, and the window to get ahead is now. Reach out to our team to explore how we can help you ride the wave with clarity, confidence, and results.