You can access an interactive version of the the User Acquisition Viability Calculator HERE.
Predicting ROAS Before Spending on User Acquisition
Being able to do that could save you a ton of time and money, couldn’t it?!
The good news is that seeing a bit into the future and having at least a rough estimate of what user acquisition (UA) results to expect — and understanding whether or not the product is even ready for a sensible UA test — is, to some extent, possible.
That’s not what frequently happens though. Here’s an example that we typically see at AppAgent:
A company, after having been relatively successful at growing their app organically, reaches a plateau and sticks to the idea of using paid user acquisition as their next growth driver. A couple of weeks and many thousands of dollars later, they find that the resulting paid UA return on ad spend (ROAS) has been horrendous; and only then do they realize that they could have seen it coming.
I believe a lot of such “failed” cases could be avoided with a simple initial analysis of the UA funnel.
To do this, we use a tool called the User Acquisition Viability Calculator. In this post, you’ll see how it can be used to provide eye-opening insights into the potential of UA.
Note: Don’t forget that paid user acquisition is just one part of a Mobile Growth Strategy.
How does the UA Viability Calculator Work?
The User Acquisition Viability Calculator is a Google Sheets (or Excel) table representing the whole UA funnel, from the first impression to the final ROAS.
After we input existing data points and assumptions, a handful of simple formulas will transfer these to a “potential ROAS” figure, which we can then analyze and examine a variety of “what if” scenarios, such as:
- What ROAS would we achieve with our current product funnel if we have a CPI of $2 USD?
- What would happen if the Trial-to-Sub conversion decreased by 33%?
- What is the maximum CPI we can afford if we aim for 150% ROAS?
- How much would the lifetime value (LTV) have to improve in order to match the expected Cost Per Action (CPA)?
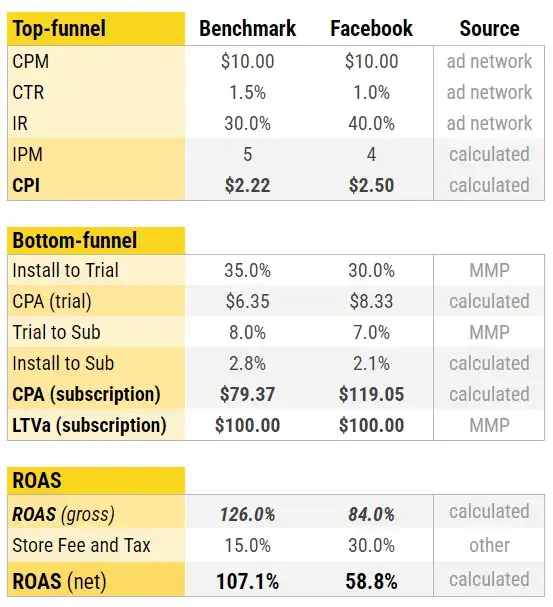
Before going step-by-step through the data preparation and analysis process, let’s see an actual example of how a ready-to-use calculator for a subscription-only monetized app would look:
Top Funnel (Marketing Funnel)
Impression to CPI
Bottom Funnel (Product Funnel)
Install to Conversion2Payer
Final Evaluation (pROAS)
Potential ROAS according to modeled costs and revenues.
How do you use the User acquisition Viability Calculator?
First, we need to fill the calculator with the best available data points. The basic idea is to input existing numbers or the best possible guess for every data point in the funnel. At AppAgent, we use results from previous “paid” campaigns and existing organic data. If neither is available, we rely on benchmarks or estimates. It’s one of the big added values we can provide to our partners.
Once the data is in, the calculator will compute the ROAS of your potential UA campaigns. This allows you to see how far or close you would be from your targeted ROAS, and using what-if scenarios, analyze how the upper funnel (from CPM to CPI) and lower funnel (from Conversion rate to ROAS) would have to look for the numbers to add up.
Case Study: Analyzing the Scalability of a New Language-Learning App
The best way to explore this framework is through a quick case study based on our historical experience with several language learnings apps. First, let’s set the scene:
A new language-learning app called TrioBingo was released in H2 2021 and has been growing organically ever since. The team landed a new investment and aims to accelerate growth through paid user acquisition. They decided to start testing paid UA on Instagram in Tier 1 English-speaking markets, as that’s where they have the highest LTV. Android is to be used as it monetizes well and allows results to be more easily evaluated. Organic data is available.
Let’s use this simple example to demonstrate the thought process behind the viability calculation.
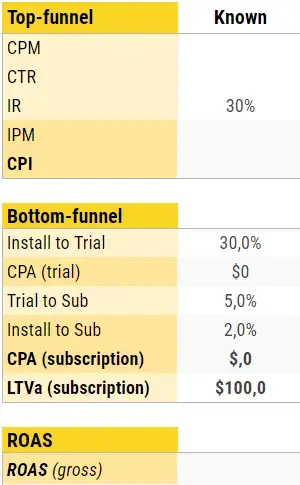
FIRST STEP: Input the Knowns
What data could we use?
There was no previous paid user acquisition, but the app has collected a large volume of recent organic data. For our purposes, though the organic data is of course not perfect, it’s the best available.
It’s important to note that, on average, paid users usually behave differently than organic users. Therefore, we must adjust the organic data values. To make these adjustments, I always examine the structure of organic traffic. This includes exploring traffic sources, search behavior, and keywords used. This helps determine whether the “paid” numbers should be better or worse. I then use experience and judgment to finalize the adjustments.
Great help for any ROAS and LTV calculation is to have an attribution tool (Adjust, Appsflyer…) implemented. If you are about to choose one, I highly recommend you to read what is the best mobile attribution partner for your app as well as guide on how to set up post-install events for mobile attribution analytics.
Let’s use the organic data that’s available, but not blindly!
Store Conversion Rate (store listing views > installs):
Looking at last month’s Google Play data, store CVR is 35%. After closely examining the composition of the organic traffic and seeing the conversion rates for high- and low-intent keywords, my estimate for paid traffic is 25-35%.
Install to Trial / Subscription
Conversion from Install-to-Free Trial from Paid UA channels is typically worse than organic. People who are attracted by the ads usually have lower install intent than users who actively search for the app’s brand or for the core functionality in the app store.
I lower the original organic numbers by 25% to account for this.
cLTV360
Subscriber LTV was calculated from historical organic data (renewal rates for Monthly and Yearly subscriptions and their price points).
Customer Lifetime Value (cLTV) tends to be roughly similar regardless of the organic/paid origin of subscribers; once a user subscribes, their renewal behavior does not typically differ dramatically.
That’s why, in this case, I’d stick to the organic $100 cLTV.
If you are interested in more sophisticated Lifetime Value calculations, contact us for Mobile Growth Summit on how real-life companies use LTV predictions for mobile apps and games.
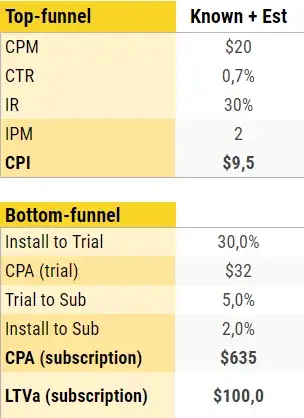
SECOND STEP: Estimate the Unknowns – fill in the gaps!
Organic numbers were helpful, but there are still a number of gaps in the Calculator. There was no paid UA yet, so we cannot have reference numbers for the top part of the funnel–the CPM (cost per mille: a “price” we’ll have to pay for showing the ad 1000x times) and CTR (click-through-rate: what % of ad impressions will result in an active “click”).
There are multiple ways to obtain the reference numbers: online benchmarks, running similar campaigns in similar geos, or historical experience. We have to accept that however hard we try, we may be somehow off with these numbers. But that should not concern us–our aim is not to reach 100% accuracy, but rather to understand the ballpark figures and have solid inputs for what-if scenario modeling.
Using estimates for CPM and CTR. Let’s do it!
CPM: I can quite safely assume that for T1 countries, my audience will be fairly expensive to reach (this will also be impacted by lots of competition in the Language-Learning vertical and my planned optimization type). The timing will also overlap with December when CPMs can be high. From the benchmarks I found and other accounts that I manage, I concluded that $20 USD is a realistic estimate for a small to medium scale.
CTR %: If we are moderately successful with video creatives on Instagram, we will likely reach a CTR of around 0.7-1%.
We’re all set now. The Viability Calculator just fills in the blanks. We already see that things are not looking too rosy for TrioBingo, but let’s pick up a magnifying glass and look more closely at the results.
THIRD STEP: ANALYZE THE OUTCOMES!
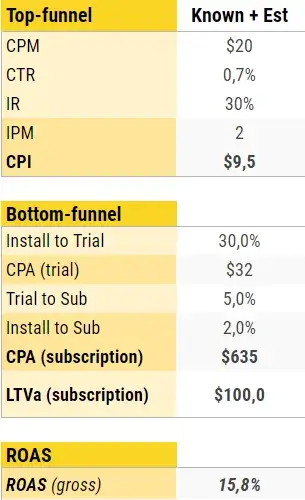
So, what do we see? How confident can we be that TrioBingo is ready for paid UA?
CPI is 10 USD. We already see that if the CPM is as we estimated, new users would be expensive. Price could be decreased by better creatives (0.7% CTR is conservative). However, this is hard to predict, and not all ads are winners. After seeing the already well-executed store assets, I concluded that dramatic improvement via better store CVR is very improbable.
CPA is ENORMOUS. $600+ USD would be impossible to sustain for a language-learning app.
Part of the “problem” is an already high CPI, but the price is mainly amplified by the rather low 2% conversion rate from install to subscription.
LTV is fairly high. Once users subscribe, they bring a moderately nice LTV. This, by itself, seems like it could theoretically support paid UA.
Estimated ROAS. All in all, the D360 ROAS (return on investment after 360 days from the initial investment) would, in this case, end up being only 16%. That’s a lot of money potentially lost.
Based on the numbers above, the situation may seem ready for throwing in the towel. But, let’s not forget that we’ve been using our assumptions and mid-range estimates to get here. Reality can be much better (or much worse). So, although this initial result already tells us something, it’s really just a starting point for the analysis.
What-If Scenarios: The Actual Analysis
Let’s widen the scope and see how far we’d have to deviate from these assumptions for our Return on Ad Spend (ROAS) to increase to a break-even point. Enter the what-if scenarios.
- Example: What if we end up having a great ad and a lower CPM? What if the paid traffic converts better (as we’ll be using event optimization)? This is all possible, and at the same time, very “predictable”.
In this final step, we’ll aim to understand what the “universes” (sets of metrics) need to be for campaigns to work. By adjusting the funnels and identifying the values required to break even, we can judge how realistic it is to achieve them.
This process is usually a back-and-forth that requires a bit of time and fiddling. Below are just a couple of examples of how to go about it.
Scenario 1
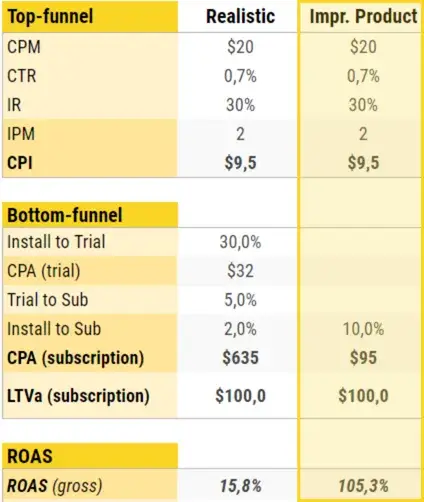
IF the marketing funnel remains the same, how much would we have to improve the product numbers?
LTV Improvements: Already a decent LTV. Quite unlikely to see any significant increase without significantly changing the product design and/or monetization.
Install-to-Sub: Would have to increase 500% (from 2% to 10%) to break even.
We see that 30% of new users enter the free trial, but only 5% of those trials convert to subscriptions. This creates a huge “black hole” leading to conclusion: This must be improved before any user acquisition is attempted.
Scenario 2
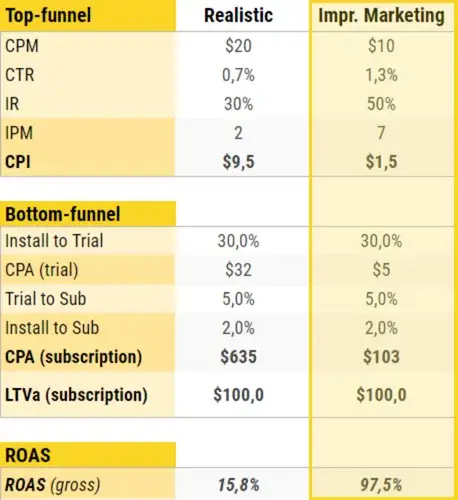
Product stays the same – how much better would the marketing funnel have to be?
CTR: Let’s say we have an amazing creative. Even then, we likely won’t get more than 1.3% CTR at any scale based on our experience with this category of apps.
CVR: We can likely get higher than the organic 30% with a great fit between ads vs. store visuals and good audience optimization, but we’ll very unlikely get over 50%. Helpful, but here, rather marginal.
CPM: We already “hypothetically” improved both CTR and CVR to the max; to reach 100% ROAS, the CPM would have to come at $10 USD, which is very unlikely.
Conclusion: It’s close to impossible to reach 100% ROAS by solely improving the marketing funnel, and marketing won’t cut it.
Product improvements are necessary; there’s not a good chance that we could be profitable even with the best version of the marketing funnel here.
Scenario 3
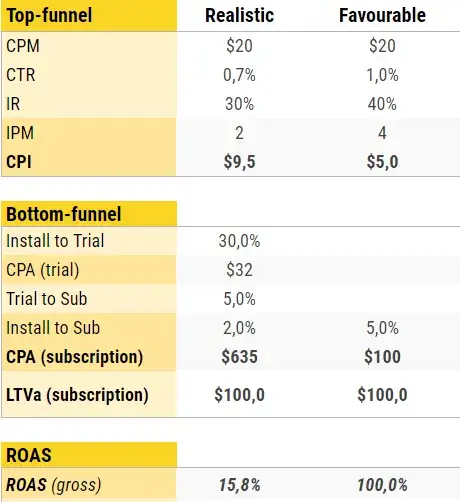
Combination of Product and Marketing funnel improvements
Only IF:
Marketing side: We get the expected CPM, nail a very good ad (CTR 1%) and the paid traffic converts significantly better (through visuals improvements and ad creative + store assets fit), we could get to a CPI of $5.
Product side: Install-to-Subscription conversion increases from 2% to 5% (by 250%!)
…we could break even.
From the above analysis, I’d clearly not advise the company to proceed with their planned paid user acquisition unless the product changes are implemented and tested.
My conclusions and reasoning would be that:
- Miracles can always happen, but I would not bet my money on it here. Instead, I’d recommend focusing on product improvements, especially the onboarding flow and paywall optimization.
- Even if we reach the best-case scenario for the Top funnel, we’d almost certainly not be able to reach ROAS breakeven unless the funnel performance of paid UA would be significantly better than the already known organic funnel performance. This is very unlikely.
- If it’s absolutely necessary to collect the data, it would be worth analyzing the potential for other countries, or other channels (which can yield different results).
- Product numbers (conversions-to-trial and subscription) would have to be improved considerably, even if we were to consider an almost perfect version of the marketing funnel.
Download the user acquisition Viability Calculator
In the example above, I aimed to demonstrate that although no one has a crystal ball, uncertainty can be, to a certain extent, wrestled with.
A few things to note before you try this at home: It’s not the tool itself, but the quality of numbers and thought process that has the real value. Making solid conclusions on your app’s potential requires carefully going through what-if scenarios. It also requires the ability to critically judge additional relevant factors that can play a role. These factors include ASO quality, traffic composition that generated the “available data points,” and payment retention. Other factors include paywall design, pricing policy in given countries, etc.
Now that you’ve been warned: You can download the User Acquisition Viability Calculator HERE and play with it yourself.
Closing Remarks
Having a grasp on paid UA viability is essential, but it’s still just a single piece of a larger puzzle. As a founder, you will very likely wish to explore what does this mean in the context of the whole business and your KPI’s, and ask additional questions like:
- What UA budget would I need to reach my required MRR / ARR numbers?
- What will be the monthly cashflow balance of the UA investments and of the app as a whole?
- What should your target ROAS be to, given some scale, generate enough margin to reach a breakeven point for the whole company?
All of this can be also modelled and analyzed. For our partners, I usually use the viability calculator as one of the inputs of a larger “Growth Model” that combines the paid user acquisition funnel estimates with other data points (e.g. organic estimates, planned budgets, and subscription retention numbers) and allows to model numerous high-level scenarios to guide the strategy and decision making.
If you’ll need any help with the viability estimation yourself, or feel that you’d require a more advanced Growth Model to understand your scalability potential, please, drop me a message at martinjelinek@appagent.com.

