A guest post by Albert Kolacek, product analyst at AppAgent. This is the first of three guest posts from AppAgent.co concerning mobile games analytics.
You’ve worked hard on your new app or game, relying on your experience and gut feeling to make it as awesome as possible. Now you’re ready for the soft launch, and you want to collect and analyze a lot of data to validate as well as iterate your product.
The question we all must ask at this point is: “Which analytics solution is best to use?”. The answer is below…
What’s out there?
There are so many mobile analytics tools out there to choose from, each with their own particular strengths. The major ones out there include:
- deltaDNA (https://deltadna.com/)
- Mixpanel (http://mixpanel.com/)
- Localytics (https://www.localytics.com/)
- GameAnalytics (http://www.gameanalytics.com/)
- Amplitude (https://amplitude.com/)
If you want to broaden your research, you could look at Omniata (https://www.omniata.com/) which is suitable for larger companies with a strong analytic department. There is also the beautifully crafted Infinario (https://infinario.com/), Upsight (www.upsight.com) which recently acquired Fuse Powered or Swrve (https://www.swrve.com/).
Before you make a decision it’s worth taking the time to investigate the options available to you.
KPIs
The most import analytics metrics are: New users, DAU, MAU, sessions and session lengths, retention, ARPDAU, ARPU, ARPPU, LTV). The good news is that all analytics solutions collect and visualize these key retention and monetization metrics very well.
In my personal experience, the most useful tools to analyze your app-specific data are funnels and event explorers.
Funnels
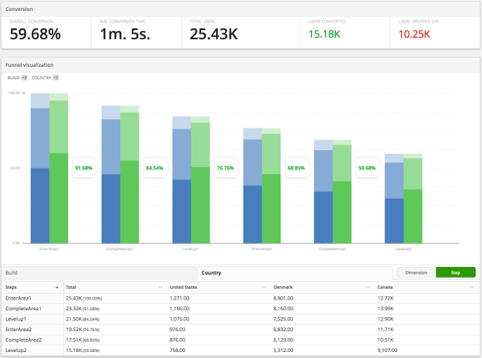
Funnels are handy tools which analyze the progression of players between several events. Sequences such as onboarding (tutorials or guided games), levels in a level-based game, purchase flows, or any general sequence you’re interested in can be thrown into a funnel, which you can quickly review after each new build is released.

Apart from step-by-step and overall drop off rates, it’s usually possible to check conversion times, segments by build, country and much more. However, the drop off rate itself is usually more than enough to help you identify issues in your app and streamline the process for the users. Doing so can help in you achieving higher retention and hopefully higher LTV as well.
Most of the solutions mentioned above have a robust funnel functionality using custom events. deltaDNA, Mixpanel and Localytics are also able to refine funnel steps by event parameters (such as the first step being event LevelUp with the parameter guestMode being NO). Currently however, GameAnalytics and Amplitude don’t offer this functionality.
Event explorer
Apart from funnels, custom events with parameters make up most of your app-specific data. This data is very useful when exploring player behavior or verifying the assumptions made during the design of the app. Being able to easily visualize events and their parameters is a must-have feature.

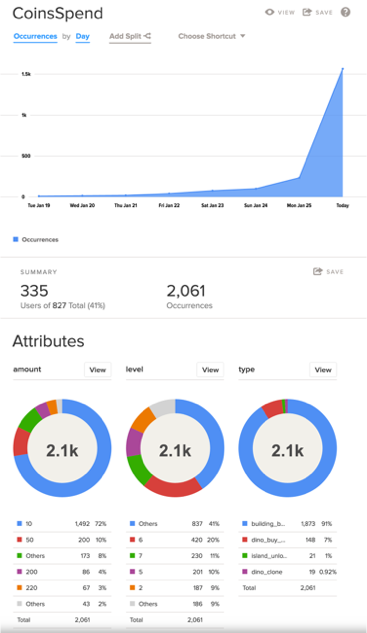
The image above shows an event tracking spending of coins (a soft currency) within a game. By exploring the parameters, it’s clear that 72% of purchases were for 10-coin items, 20% were made on level 6, and 91% were for purchasing a building. Only 7% of purchases were for buying a dino.
Having this information allows me to make changes and assess their impact. For instance, I might choose to try different pricing strategies like lowering the price for dinos over a short time to see whether this has an impact. In this example perhaps they cost 40 coins and players like to buy a larger amount of cheaper items, so lowering the price will help. Either way, when a new build is released we’ll immediately know if the changes were successful or not by having access to the data and regularly reviewing it.
Both deltaDNA and Localytics offer good event handling but for slightly different audiences deltaDNA is oriented more towards senior data analysts (offering raw SQL access), whereas Localytic’s event explorer is suited to the general public (see the previous picture).
Amplitude and GameAnalytics don’t support the exploration of event parameters, and GameAnalytics allows only one numeric parameter for each event. It is possible to work around that limitation, but at the cost of dramatically increasing the amount of events (e.g. several variants of IAPDialogOpenFromXXX instead of one event).
Cost
deltaDNA is aimed at experienced data analysts with custom SQL queries and data exports, which puts their prices at a premium: after the initial 10k MAU for free, it costs $150 per every 10k MAU.
Mixpanel’s pricing is based on data points (events sent), with the first 25k free and then around $200 for every million. (https://mixpanel.com/pricing/)
Localytics have MAU-based pricing with the first 10k MAU free and then around $80 per 10k MAU. (https://www.localytics.com/pricing/)
GameAnalytics is free.
Amplitude is free for the first 10 million monthly events, then $995 for the next 100 million.
So which one should I use?
As usual, the answer is it depends on a number of factors. If you’re only interested in the bare minimum, then the free solutions such as GameAnalytics or Unity Analytics should be enough for you.
If you want to get serious by spending the time and effort to analyze as well as improve upon your app in the soft launch period and beyond, then I’d recommend Localytics. The price-performance ratio is good and the solution offers solid funnels, an event explorer, dimensions, screen flows and custom dashboards.
Experienced data analysts (who probably don’t need my advice anyway) should have a look at deltaDNA which offers some very advanced features such as custom SQL queries and a raw data export.
Just do it
Whichever solution you end up choosing, it will have a free tier that should be generous enough to let you evaluate it properly during the soft launch. It should only take a couple of hours to get the SDK up and running, and if you’re not happy with the results you can always decide on something else for the global launch.
Feel free to reach me with your questions or comments at [email protected]. The next part ‘A practical guide for integrating mobile analytics’ will be published the next week.


