To learn more about industry insights and best practices, like mobile apps & games LTV prediction, sign up for the AppAgent newsletter here.
Identifying a suitable post-install event and generating an accurate lifetime value (LTV) prediction could help you significantly improve user acquisition performance. In this article, we explain what an LTV prediction is, the critical role the post-install events play in calculating LTV and how we improved the return on ad spend (ROAS) of a language learning app by 300% thanks to an unexpected finding.
The State of the Subscription-Based Apps Market
Revenue from subscription-based apps hit a record during 2020, reaching $13 billion, according to Sensor Tower. However, a whopping growth of 34% year-on-year doesn’t mean it’s easy to make a living from charging recurring fees on non-game apps.
In fact, it’s quite the opposite. Most subscription-based apps face very tough challenges in the post-IDFA (identifier for advertisers) era. Previously, strong monetization of the iOS user base––which generated nearly 4x of revenue compared to Android in 2020––showed a downward trend. At the same time, the cost of acquisition among some of our non-gaming clients grew by up to 500%.
It comes as no surprise that publishers are exploring how to fight this negative trend. Besides creative optimization and audience expansion through using a motivation-led creative approach (see AppAgent’s Mobile Marketing Creative Series), growth marketers have other major levers at their disposal: optimization events and LTV prediction.
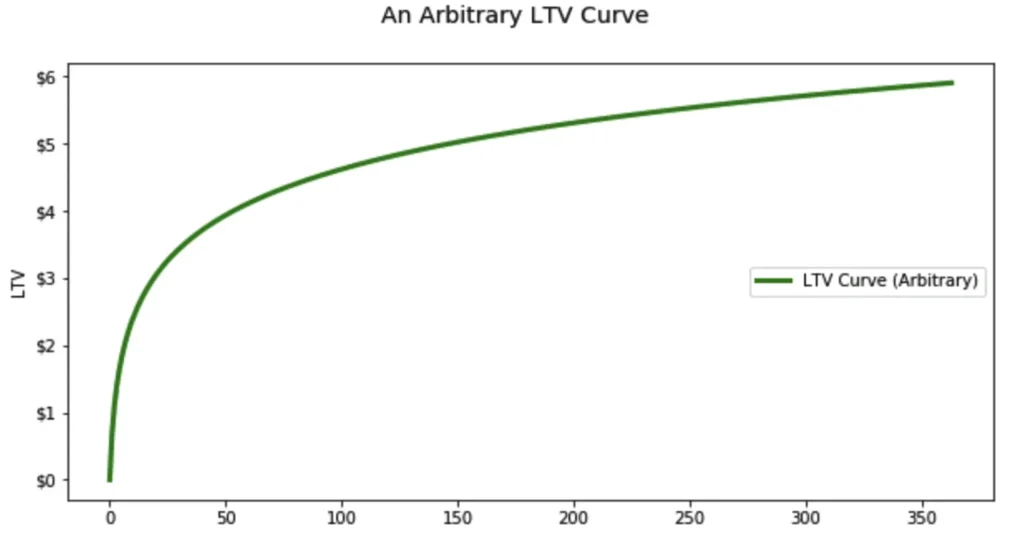
What is LTV – Lifetime Value Prediction?
LTV is the projected revenue that a customer will generate over their lifetime. LTV helps marketers to forecast campaign performance early on, make long-term predictions with limited data, and optimize marketing spend while maximizing revenue.
3 Basic Approaches to LTV Prediction
1) Behavior-driven/user-level predictions
Analyzing in-app user behavior/properties to identify actions or combinations that predict a new users’ value.
Example: User A had 7 long sessions on day 0, with a total of 28 sessions by day 3. He also visited the pricing page and stayed there for over 60 seconds. According to the regression analysis and machine learning-based algorithm, the probability of him making a future purchase is 65%. Using an ARPPU value of $100 USD, his predicted LTV is therefore $65.
2) ARPDAU retention model
Calculate the number of active days from a modeled retention-curve, by calculating the area under the curve. Then multiply the active days by the average revenue per daily active user (ARPDAU).
Example: Day1/D3/D7 retention are 50%/35%/25%. After fitting these data points to a power curve and calculating its integral until D90, we find that the average number of active days is 5. Knowing that the ARPDAU is 40 cents, the predicted D90 LTV would equal $2 USD.
3) Ratio-driven
Calculating a coefficient (D90 LTV/D3 LTV) from historical data, then applying this coefficient to multiply the real D3 LTV to get a D90 LTV prediction for each cohort.
Example: After the first 3 days, ARPU for our cohort is 20 cents. From historical data, we know that D90/D3 = 3. The predicted D90 LTV would thus be 60 cents (20 cents ARPU*3).
LTV Prediction for Subscription Monetization
To illustrate our point, let’s focus on a real case that demonstrates how to calculate the LTV for a language learning app that charges users monthly ($30) and yearly ($240).
Such a model has two major components:
- what is the LTV after subscription; and
- what behavior leading to subscription happens before the actual user commitment.
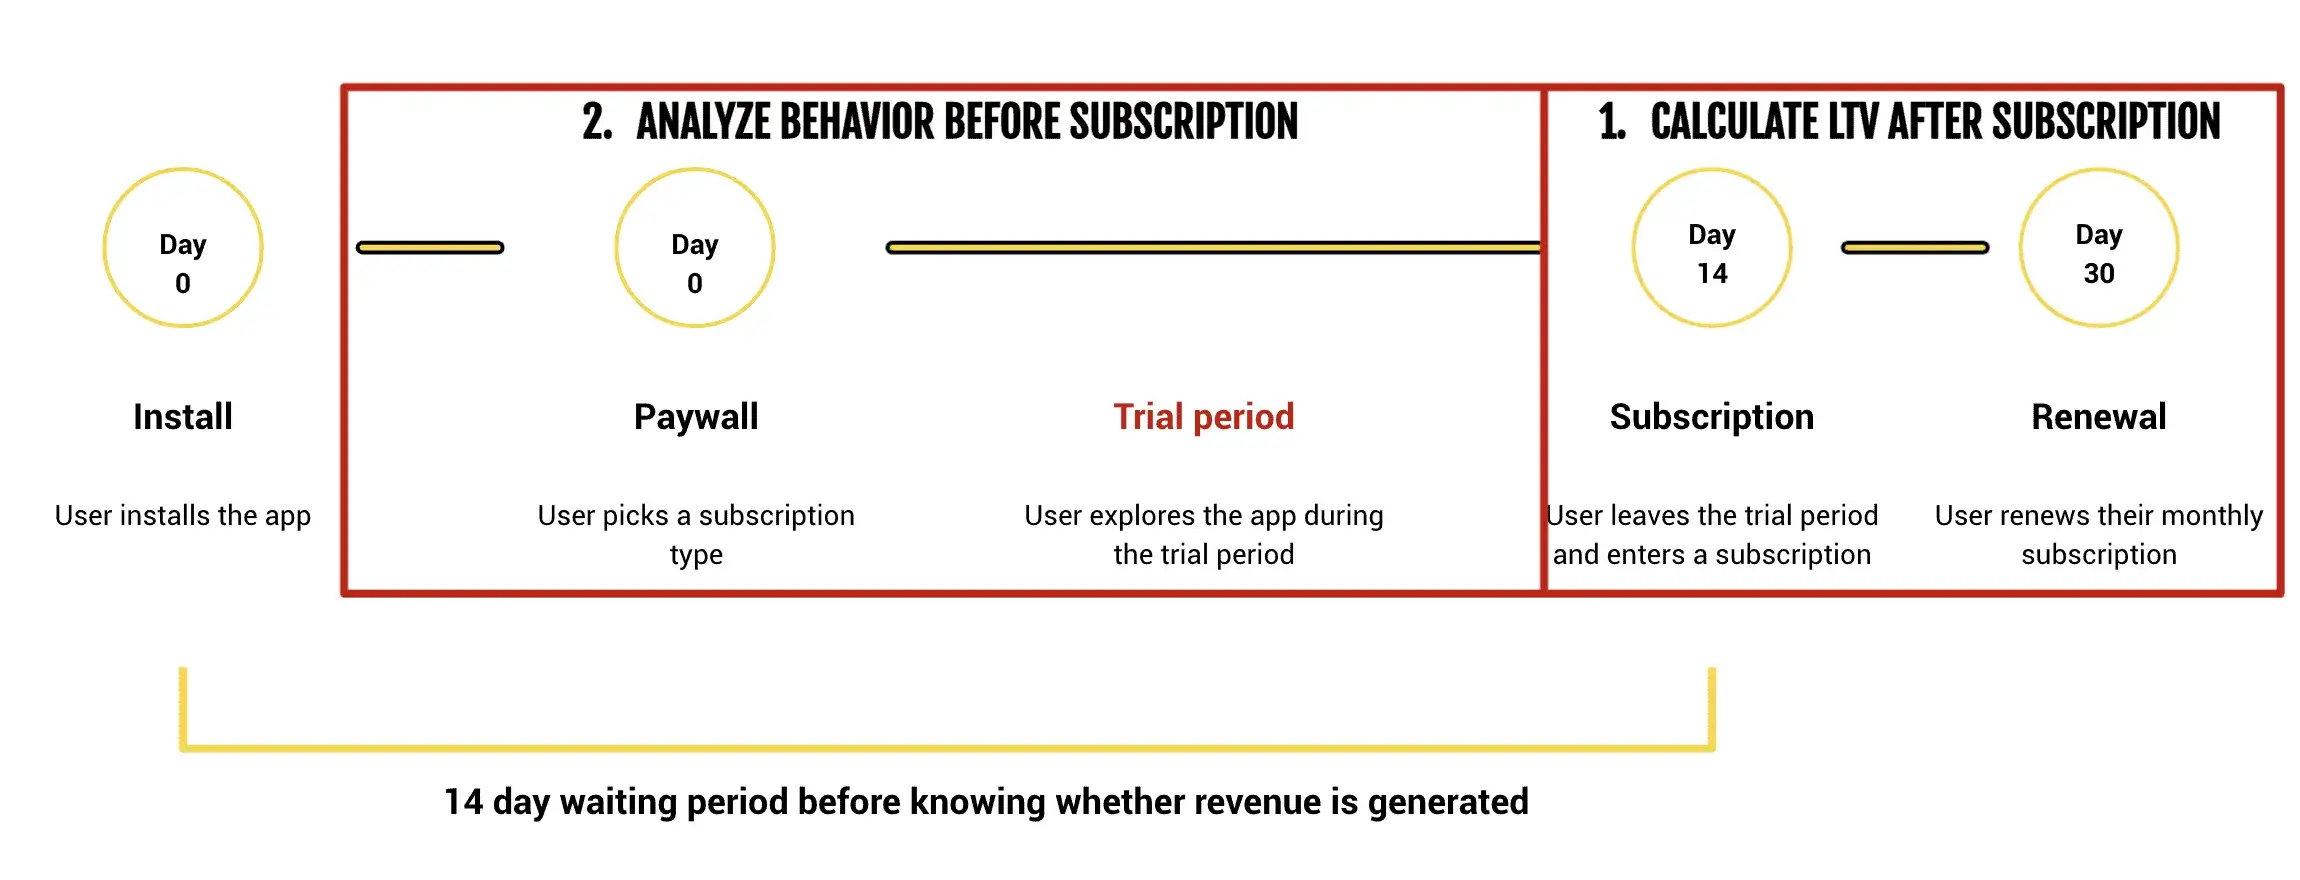
Here’s a step-by-step process of how to calculate LTV:
- First, decide over which time to calculate LTV. Typically it’s 90 days, 180 days, or one year. You can choose to segment by country, channel, or platform. In our case, we split the LTV model into subscription type and country (the world and the US).
- Second, gather retention data for subscribers and extrapolate for months when data is not available. (You can achieve this by fitting a power curve and applying a trendline to existing data.)
- Calculate the active months from the retention data by summing up the monthly retention numbers: 100% (Month 0) + 45% (Month 1) + 36% (Month 2) + … + … = 330%. Do the same for yearly subscriptions. In our example, that is 130%.
- Then calculate the average split between monthly and yearly subscriptions. (70% vs. 23%.)
- Finally, you’re ready to calculate the LTV for a random user from the US: Monthly sub % X Active months subscribed X monthly sub price + Yearly sub % X Active years X yearly sub price = 0.7 X 3.3 X 30 + 0.3 X 1.3 X 240 = $163.
Key Metrics to Track for Subscription Apps
To feed your LTV model, you need to continuously track:
- Trial start and cancellation timestamps
- Time to first app open post-install
- Number of unique active days in trial
- Pricing page views and dwell time
- Content consumed before conversion
Tools like Mixpanel, Amplitude, or Firebase are essential for collecting and validating this behavioral data.
How to preform Regression Analysis?
In order to be able to quickly see the potential value of acquired users, you must analyze their behavior before they subscribe. To be able to perform regression analysis, you must have basic data available, such as:
- Historical raw user behavior data stored, for example, in BigQuery database, Amplitude, or Mixpanel.
- Post-install events selected, such as Consumed content, Learned content, Cancel free trial, and Paid subscription from free trial.
At a high level, a data analyst is searching for a correlation between behavior data and conversion rate on day 0, day 3, etc. The challenge is to identify a strong predictor that (in the ideal world) correlates 100% with future subscriptions. This, however, is never the case, so the role of the data analyst lies in finding the right balance between the frequency of the early event and its prediction accuracy.
An example of finding the Optimal Predictive Event
So, we’ve described the theory of how to define a predictive event, now let’s move to a practical demonstration.
In the case of our language learning app, we established that users with a higher engagement count have a better conversion rate over time – but that this only becomes apparent later in the free trial. Users appear to move slowly into higher engagement, suggesting continued usage. Obviously, this is a problem if a UA manager has to make a quick decision about optimizing the acquisition campaign.
So, we investigated whether early continued engagement yields higher conversion rates.
It did, so we investigated which app functionality drives higher conversions. We also examined when users canceled subscriptions.
The analyst then went through each event to identify correlations. Below, for example, a graph shows conversion rate evolution increasing with more active days spent in the app. The hypothesis is that if we see regular app usage early on, those users will more likely convert to paying customers once the trial ends.
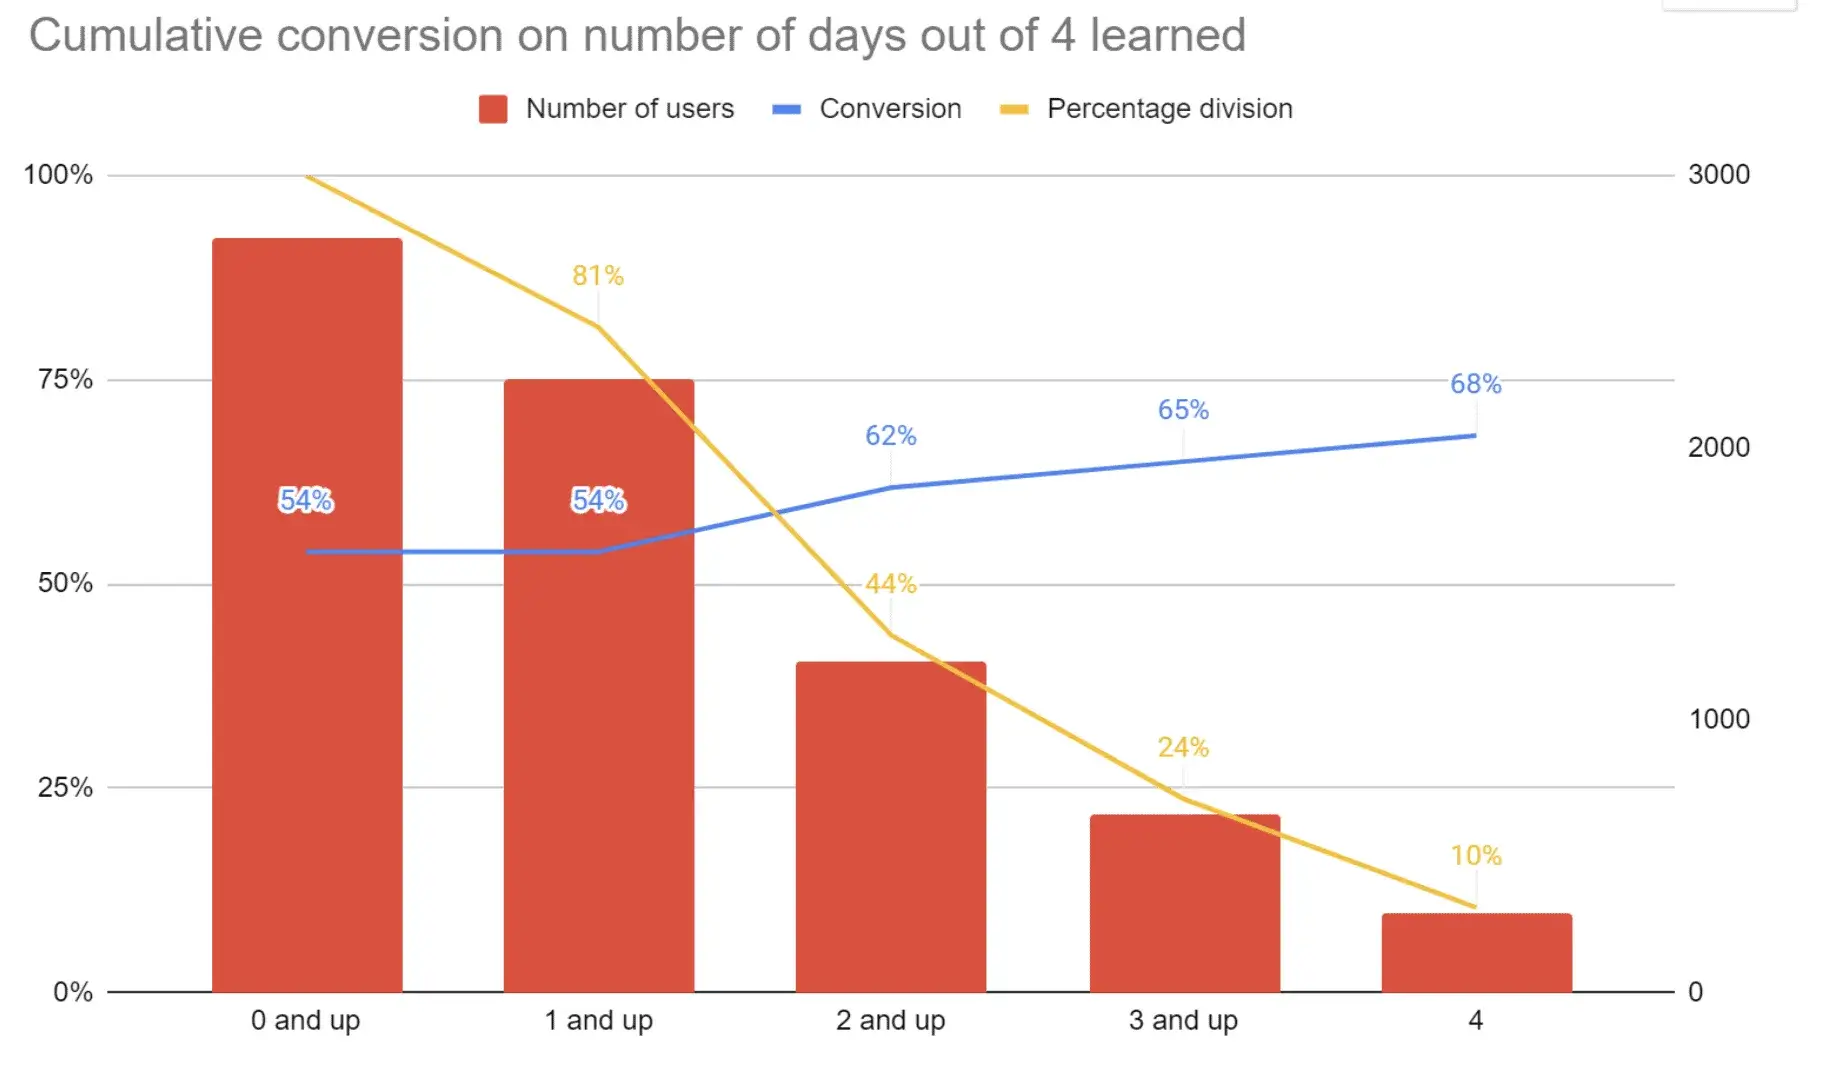
To illustrate learnings from this particular step of the analysis, we can see that when users are active for 3 or more days out of 4 (31% of users), this segment has a 15% higher conversion than average. Unfortunately, the difference isn’t substantial enough to use this as a solid indicator of a future subscription.
The “A-Ha Moment”
Typically such an analysis happens after 15-30 engagement or functional events (those represent, for example, having “listened to a lesson” or “completed a test”).
Unfortunately, none of these classic post-install signals was strong enough to be used for the LTV prediction or later as an optimization event for Facebook and Google Ads campaigns.
That was until we spotted an interesting behavior: 16% of iOS and even 33% of Android users canceled their subscriptions on day 0! That’s when the free-trial ends and switches to a paid subscription.
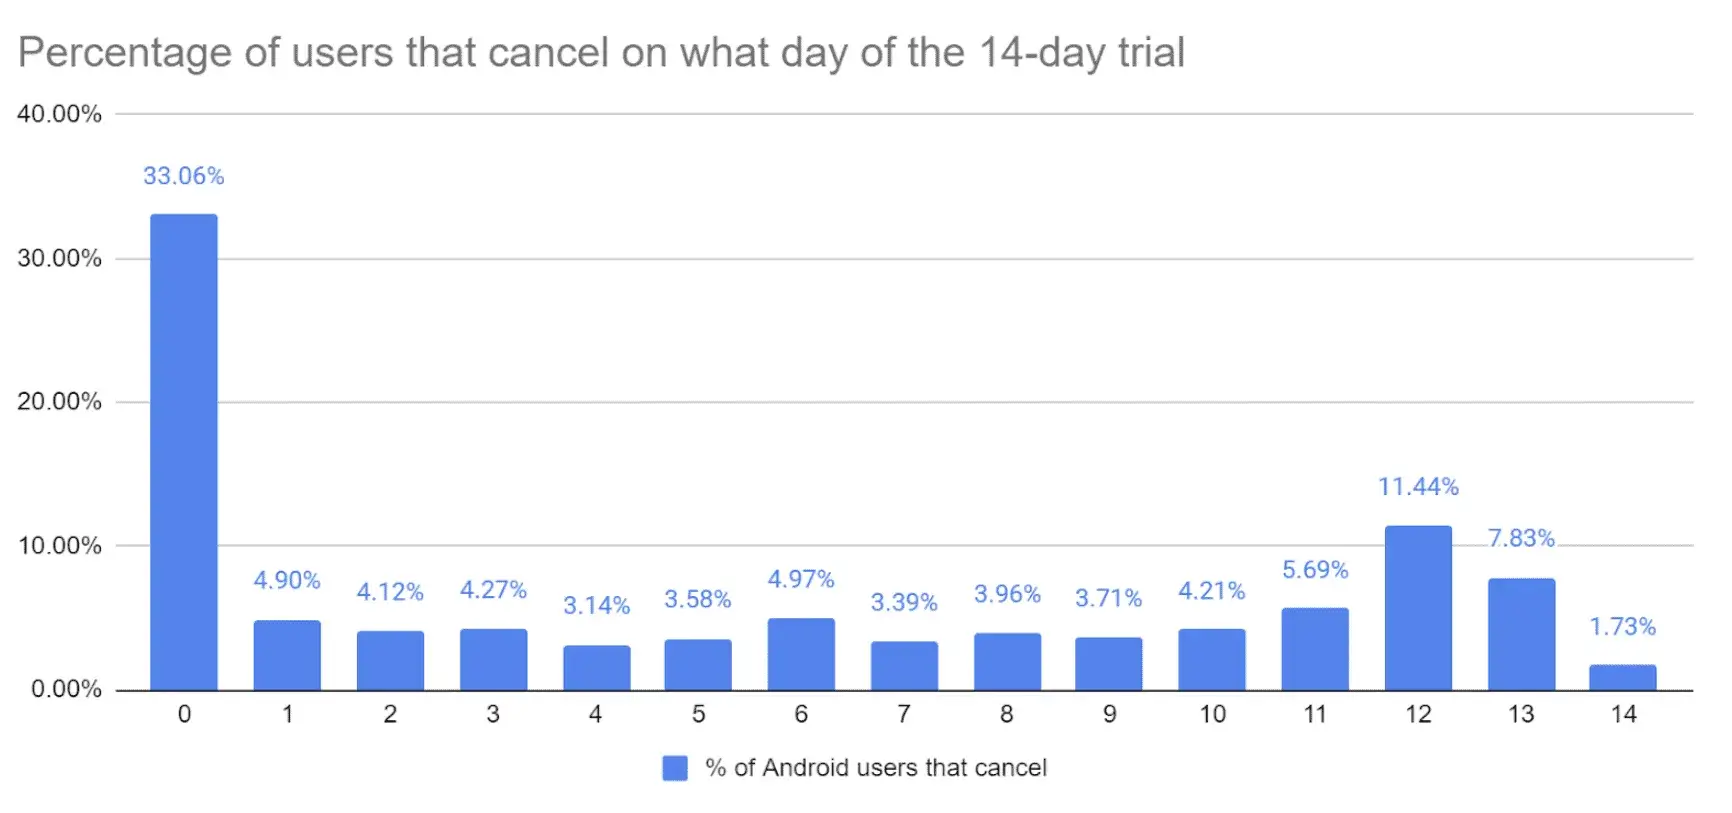
It’s a counter-intuitive signal; a negative behavior. However, the insight could be used for data science purposes. In this case, trial cancellation happens very early and it’s performed by a segment of an optimal size for this purpose.
The trial cancellation data, combined with the number of times a user was active during the first four days, enabled us to develop an accurate LTV prediction formula after searching for weeks.
Why “Bad” Behavior Became Our Best Predictor
Canceling a free trial used to be considered a failure — until we looked deeper. It turned out to be a signal of intentional user action. These were users actively managing their subscription, not passively dropping off. Combined with early usage patterns, this created a powerful new optimization event.
The Business Impact of a Solid LTV Prediction
An accurate LTV prediction enables UA managers to predict how successful a campaign will be at attracting paying users without needing to wait until the free-trial period is over.
Additionally, such an analysis helps app owners to identify the best post-install event on which cost-per-action (CPA) campaigns should be optimized. Today, the majority of high-quality traffic on ad networks such as Facebook and Google comes not from cost-per-install campaigns but from CPA campaigns that drive users who are most likely to complete the desired event.
By optimizing for “trial not canceled within the first 2 hours” instead of the usual “trial started”, we increased the conversion from install to subscription from 2.6% to 8.3%. This ultimately led to increased return on ad spend by a whopping 183%!
Wrap-Up: LTV Prediction = Smarter Scaling
In a subscription-driven world, your growth hinges on knowing not just who installs, but who stays, pays, and renews.
By identifying high-signal early behaviors, building user-level predictive models, and optimizing ad campaigns around custom post-install events, you can radically improve your ROAS and user quality — even in the post-IDFA chaos.
👉 Want to build your own LTV model? Start with our Retention to LTV Calculator to estimate monetization potential by cohort.
👉 Need help finding your optimal event? Let’s talk data strategy — Contact AppAgent.
