This is part nine of the Mobile Marketing Creatives Series where we focus on creative testing for mobile ads. In ten episodes, we aim to provide insight and inspiration on creating thumb-stopping visuals to promote your app.

Download the Mobile Ad Creatives eBook today to read the other nine parts of this series. The comprehensive guide includes ten core topics condensed into a practical blueprint with examples from AppAgent’s Creative Team.
In this article, you will learn:
- Why creative performance is tested on Facebook.
- Which metrics to follow and how to avoid hidden pitfalls.
- A comparison between the Facebook Ads dashboard and the MMP (Mobile Measurement Partner) dashboard.
Testing Mobile Ads on Facebook
For the majority of publishers, whether in the gaming or non-gaming industry, Facebook serves as the primary platform for testing creatives. This is because Facebook offers comprehensive insights into the performance of individual ad creatives. Through this platform, you can easily identify the most effective placements and gauge the level of engagement for each creative.
Unfortunately, these valuable data points are no longer accessible for Automated App Ads (AAA) campaigns and iOS due to the IDFA deprecation, which we will delve into below.
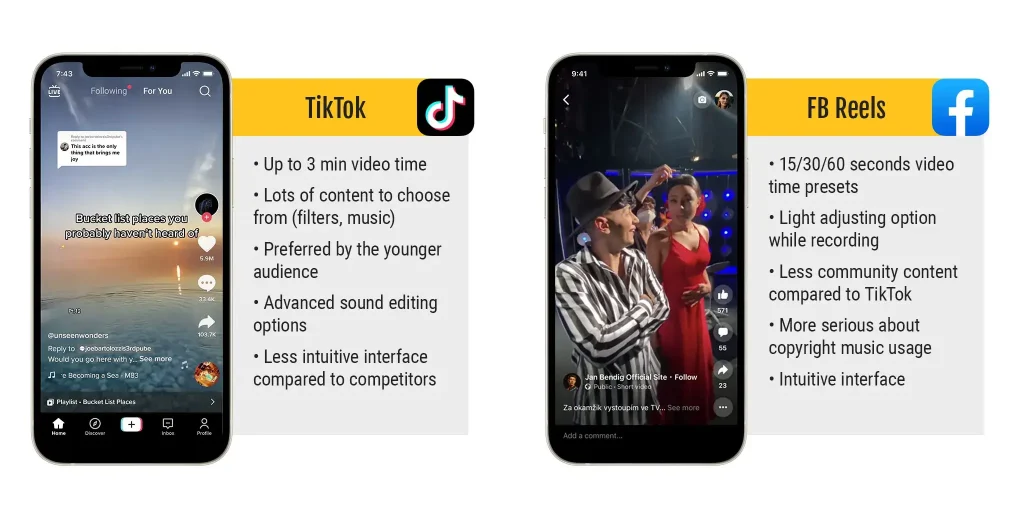
Furthermore, Facebook offers various ad placements that can offer valuable insights for enhancing creative development. For instance, if a specific ad performs exceptionally well in Reels, it would be prudent to utilize the same ad on TikTok (In case you aren’t familiar, Facebook Reels is akin to TikTok in its functionality).
At AppAgent, placement testing takes precedence, as our designers rely on the results to determine the most suitable creative formats to concentrate on. For additional information, I highly recommend perusing Facebook’s post on understanding how audiences engage with mobile video ads across different placements.
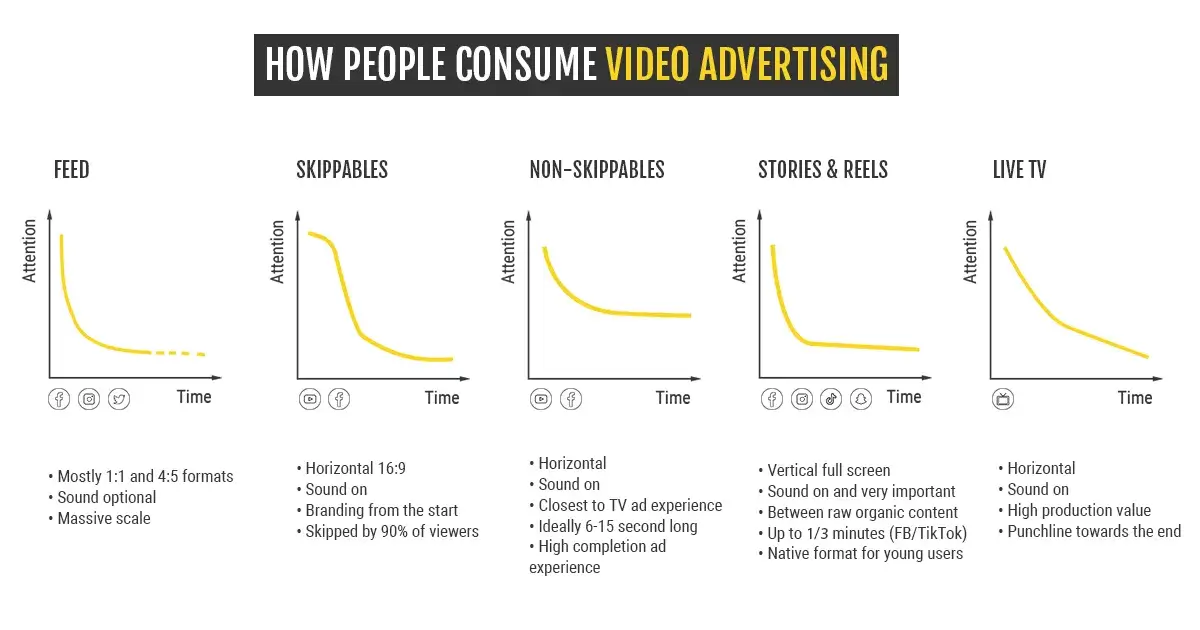
Google Ads, the second biggest user acquisition channel on mobile, doesn’t allow you to control and evaluate individual creatives and placements. Unfortunately, insights from Facebook can’t be directly applied to other platforms, so it’s not suitable for testing creatives.
Companies with successful ads on TikTok should create a specific creative strategy for that platform. However, the introduction of Facebook Reels may make this unnecessary if tests show that the creatives perform well on both TikTok and Reels.
Another option utilized by large publishers for creative testing is programmatic media buying. However, this approach is more limited in its application due to its technical complexity and the larger budgets required for implementing this user acquisition strategy.
How to Conduct Creative Testing For Mobile Ads
We’ve summed up our knowledge on this subject in the Creative Testing Guide, so for the purpose of this article, we will cover only the fundamentals.
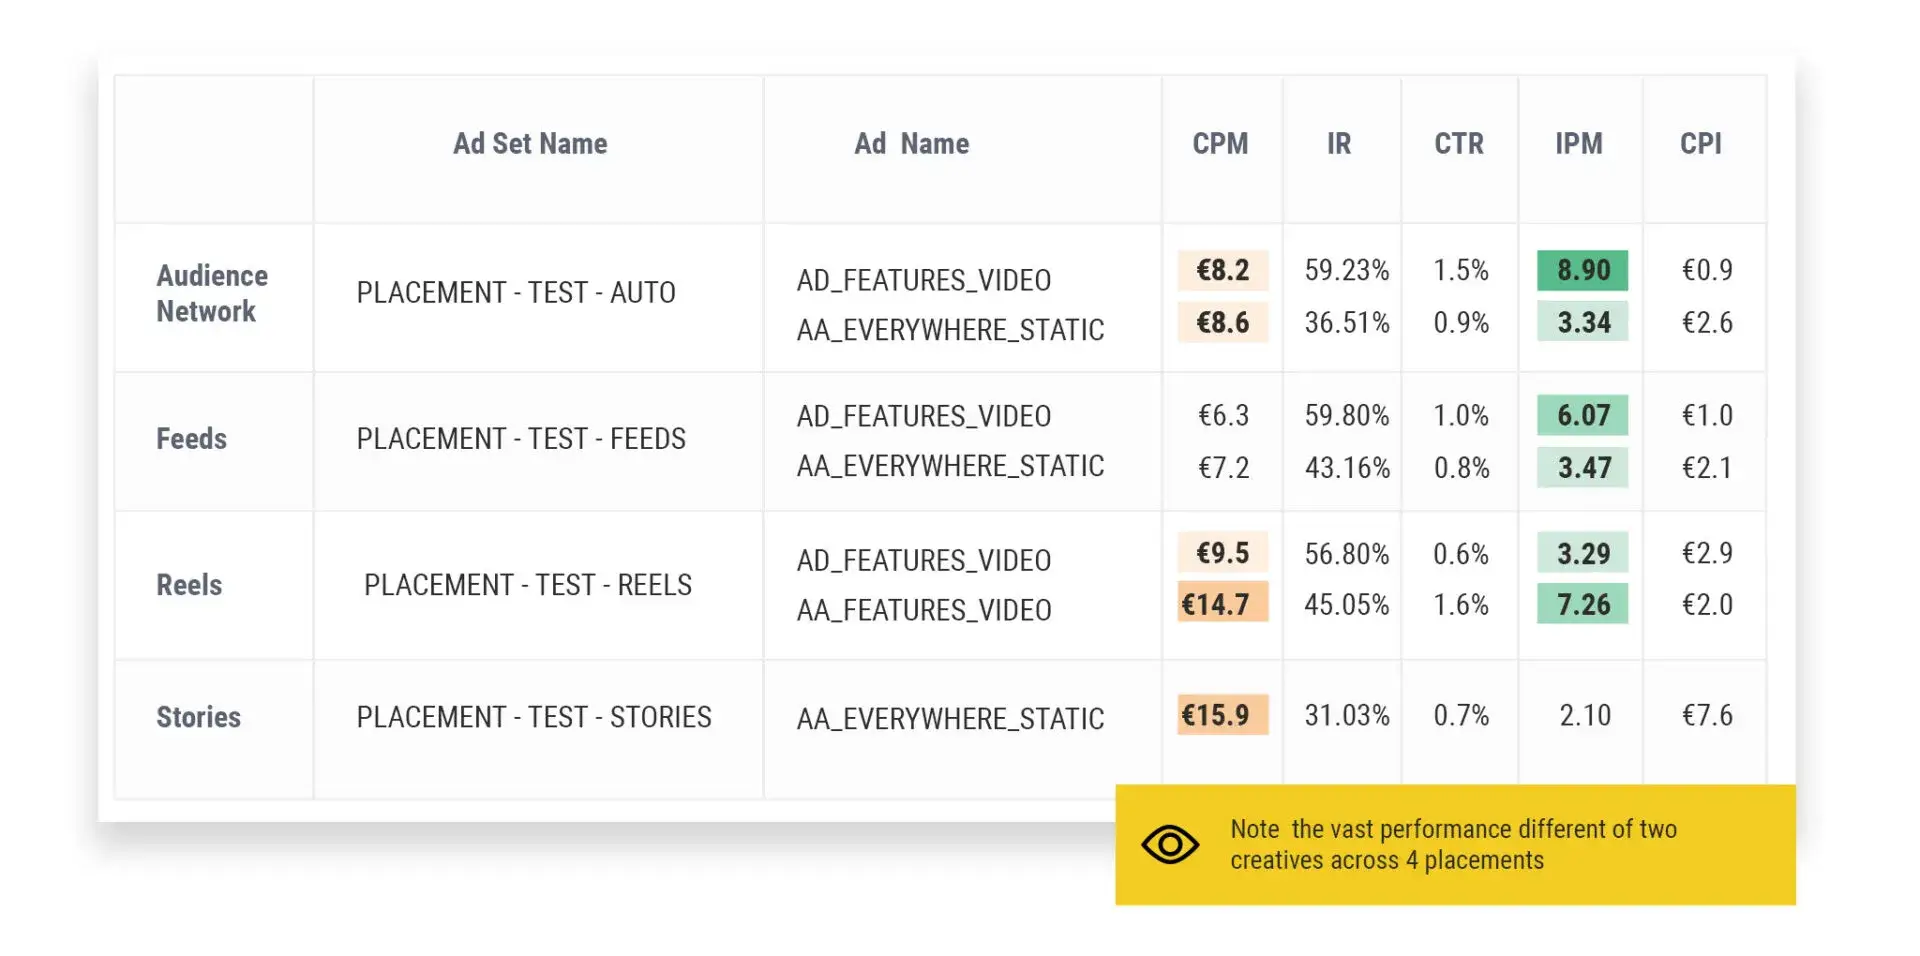
The initial step in the creative testing process involves identifying the most effective placement. This is accomplished by creating a universal ad creative concept that can be adapted to fit various placements, including Facebook Feed, Audience Network, Stories, and Reels.
The essential key performance indicator (KPI) for every User Acquisition manager in creative testing is represented by the abbreviation IPM, which stands for “installs per mille,” indicating the number of installations per one thousand impressions. The term “mille” is derived from Latin and means one thousand. IPM signifies the ratio of installs received for each creative exposed per one thousand views.
What makes IPM the best metric for creative evaluation? It effectively merges the click-through rate (CTR) of an ad with the install rate (IR) in app stores.
However, it’s important to note that it’s not a perfect measure, as explained by Thomas Petit:
“Looking at both CTR & IR is definitely insightful about how the messaging is perceived. But those numbers aren’t telling the whole story of creative performance. Be aware that with some of the installs coming through view-through attribution, a click may not be happening between an impression and an install: IPM is NOT exactly equal to CTR*IR!”
In most cases, these two conversion metrics are interrelated – a high CTR often results in a lower IR, and vice versa. Typically, an ad that is more captivating and garners more clicks might lead to a less relevant audience and a greater disconnection with the product presentation in the App Store or Play Store.
As a UA manager, you face an ongoing challenge to strike a balance between creating attractive ads that lead to high conversions in the store and ensuring user retention after downloads.
Speaking of retention, alongside IPM, there’s another crucial metric that every UA manager should monitor: DX retention. This metric reflects the quality of the traffic generated by a specific creative. However, deeper funnel metrics, such as first payments, may not be available quickly enough to take immediate action during the initial stages of creative testing for mobile ads. Exceptions to this are subscription apps with a high free to trial ratio or ecommerce apps.
How do you identify the best-performing creative?
AppAgent’s preferred creative concept testing methodology involves placing one creative into an ad set and launching 4 to 5 ad sets (each with new creatives) simultaneously.
This approach compels Facebook to impartially test the new creatives without any inherent bias. Extensive testing has consistently demonstrated that if a top-performing creative is mixed with new ones, it consistently outperforms the contenders (new creatives).
On the contrary, if contenders are grouped within a single ad set, the Facebook algorithm swiftly begins to favor one of them, and insufficient traffic is allocated to the other creatives, preventing them from reaching statistically significant levels.
On the other hand, you can complement this approach with another strategy employed by Thomas Petit: “As soon as I get a winner among the new, I move it out and get data on the rest.“
The primary objective of the creative testing process is to reach a threshold of 100 installs and 10K+ impressions per creative, which enables a comprehensive evaluation of the initial data. This encompasses performance metrics for each new creative, including impressions, CPM, CTR, install rate, and cost per install.
Typically, this testing is conducted on a broad audience to determine if Facebook can effectively identify the right segment for each creative.
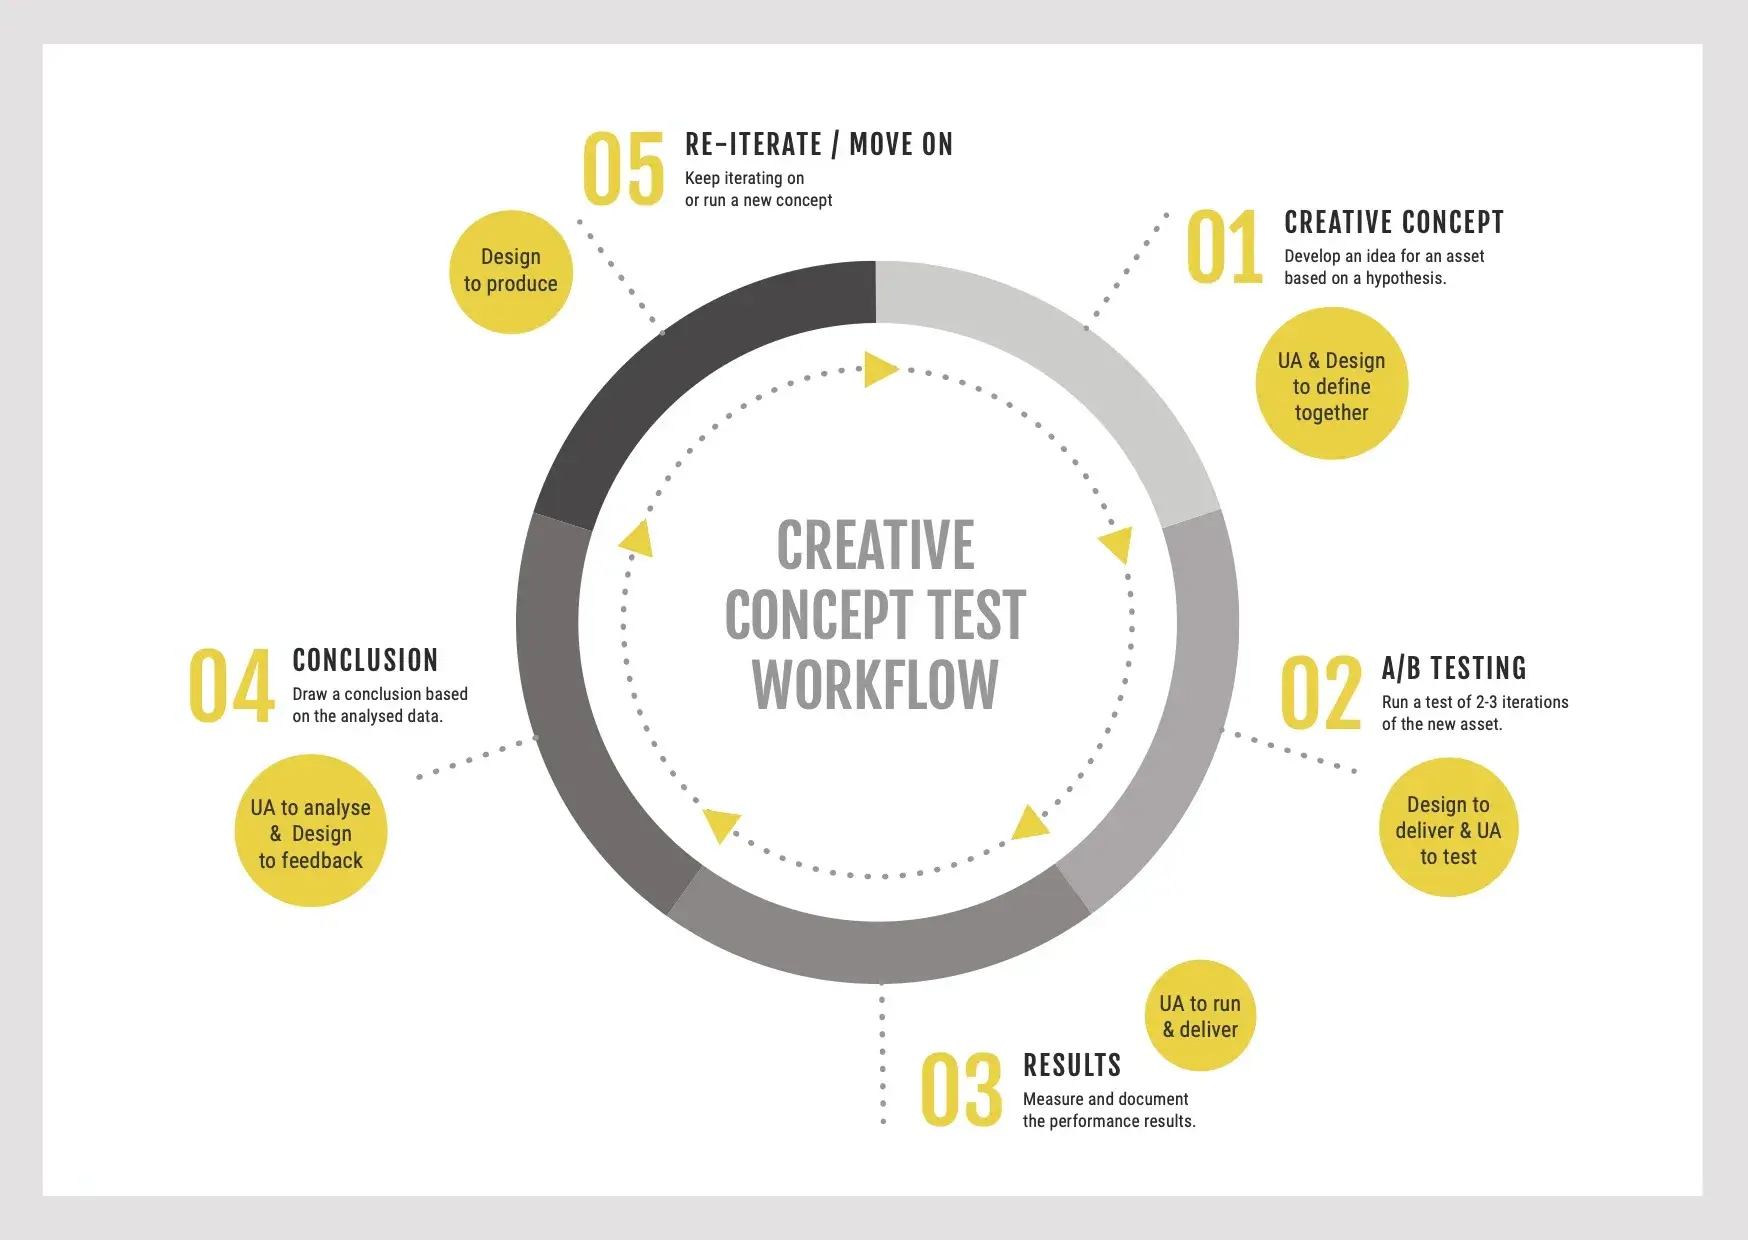
Our primary focus is on testing in one main market, typically the US. However, the geographic targeting approach can vary depending on the specific app or game.
During the soft launch phase, for example, priorities might differ, and the testing could be more targeted. It’s common for testing in the main market to commence at later stages in the process.
The Impact of IDFA on Creative Testing for Mobile Ads
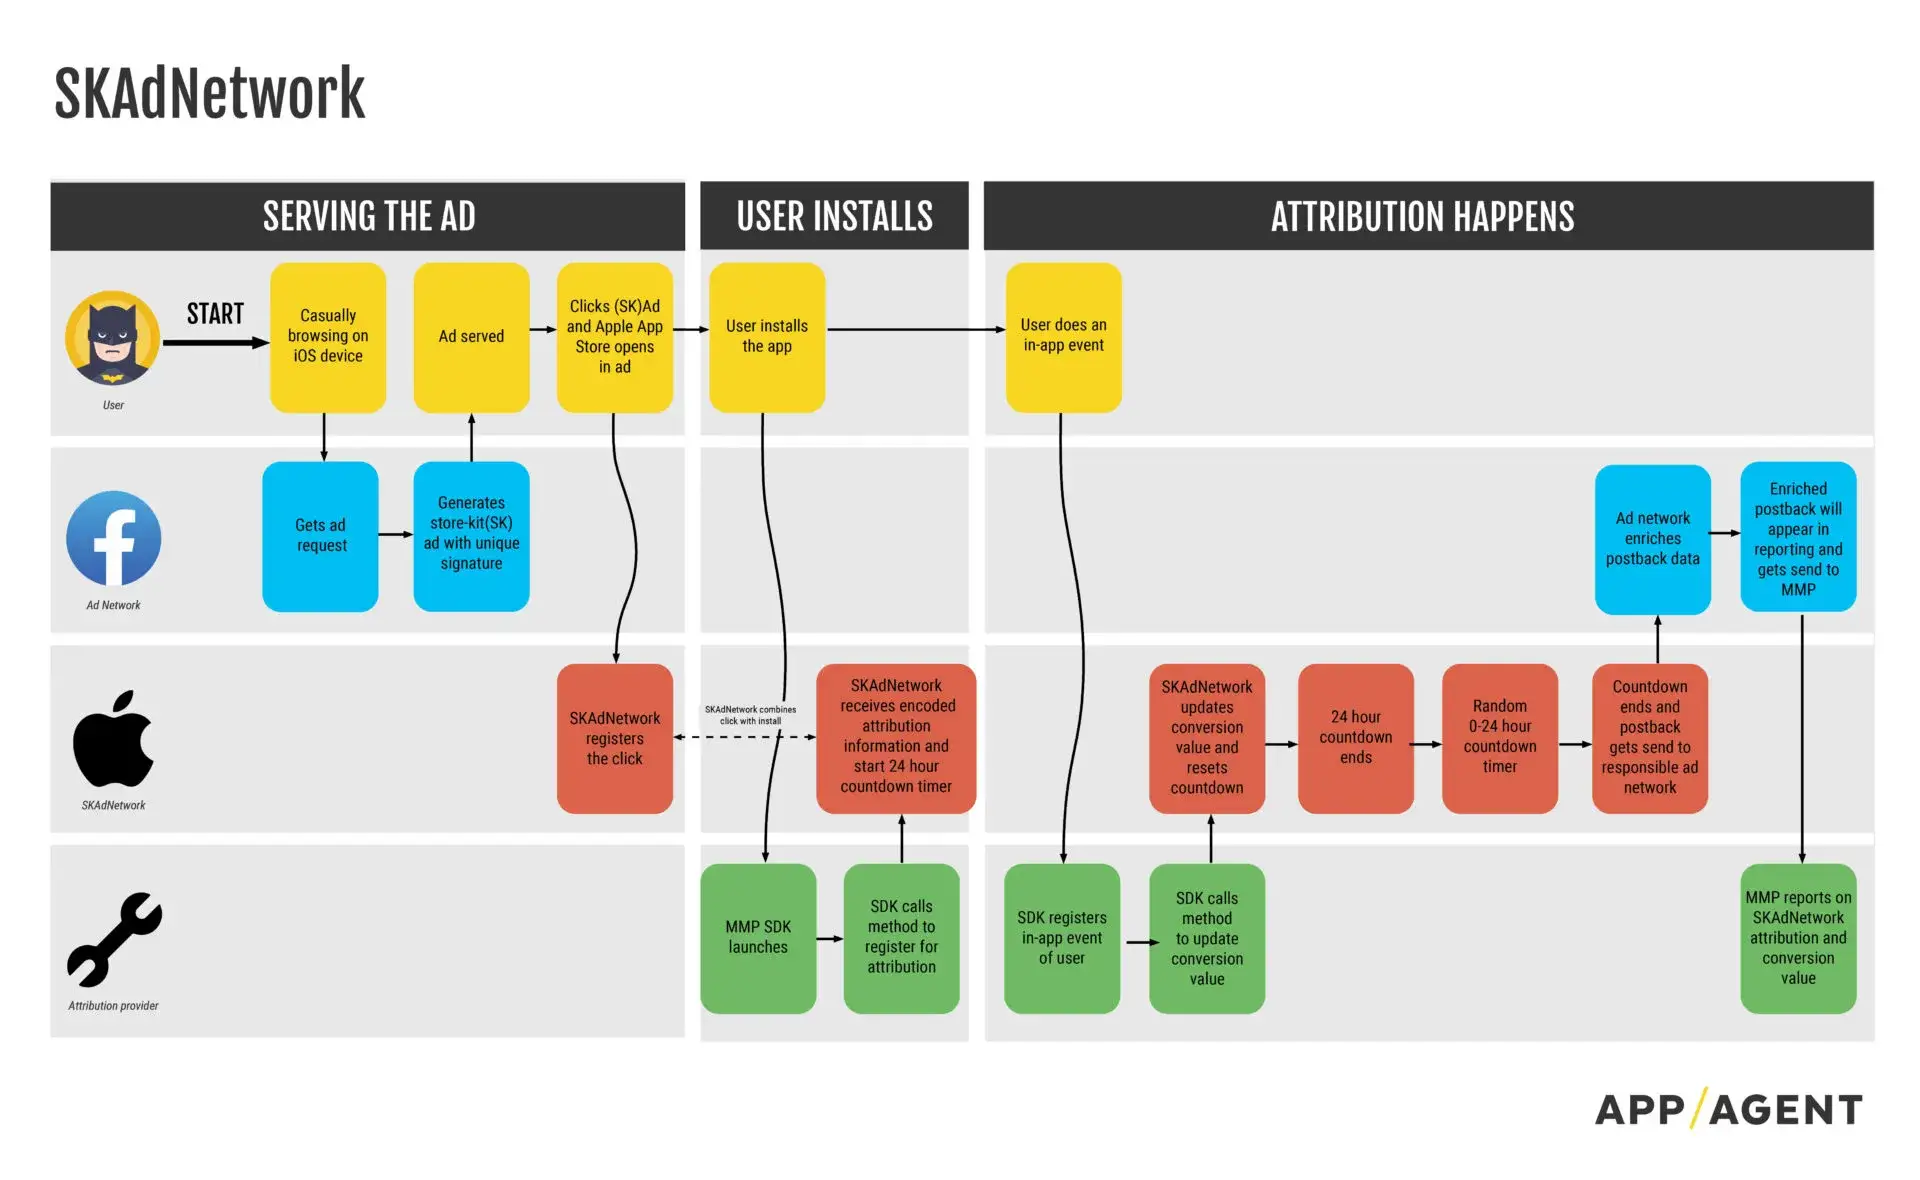
Privacy changes on the iOS platform have significantly impacted user acquisition managers, leading to a notable reduction in available data. As Thomas Petit clarifies,
“Whatever you see off the ad network–beyond a click–is not actual, but modeled data. Except for data points coming from Facebook, such as impression, click, and 3-second views, everything else is extrapolated. That’s because Apple passes back only campaign-level data.”
Currently, ad testing primarily takes place on Android, where it’s still possible to conduct a detailed analysis at the creative level. While utilizing creative performance data from Android for iOS campaigns may not be the ideal approach, historical data suggests that top-performing UA creatives have shown similar success on both platforms. Nonetheless, it’s important to note that this trend may be product-specific.
To better align with iOS user profiles, we implement a filter on the Android version, specifically targeting devices with a version of 10+ to exclude low-end devices.
If your audience pool is larger, you have the option to adjust the fields, such as adding older versions, whitelisting specific top devices, or blacklisting poor devices. This allows you to showcase your ads exclusively to owners of high-end Android devices.
Another challenge in creative testing on iOS is the issue of delayed reporting. Postbacks, which provide UA managers with specific behavioral information (such as onboarding completion, starter pack purchases, or reaching level three) experience significant delays. These delays can be up to 3 days after the actual postback occurs, while the spend data from Facebook is almost real-time.
This discrepancy makes evaluating campaigns and creatives on iOS difficult. It provides yet another reason to prioritize creative testing on Android, where the reporting is more timely and reliable.
The Pitfalls of Creative Performance Evaluation
When exploring the best creative testing and evaluation setup for your company, there are certain pitfalls to consider:
Negative impact of ad account: Surprisingly, your ad account can negatively influence the performance of new creatives. In some cases, it might be better to create a new ad account to reset historical data, especially if you find it challenging to surpass the performance of the control creative over an extended period.
Incomparable metrics across placements: Metrics like CTR, install rate, and IPM can vary significantly between different advertising placements. For instance, an ad in Facebook News Feed will have a distinct funnel compared to an ad displayed in Stories. To address this, I recommend evaluating creative performance segmented by placement. As you accumulate more data, you can then delve into deeper funnel metrics for a comprehensive evaluation.
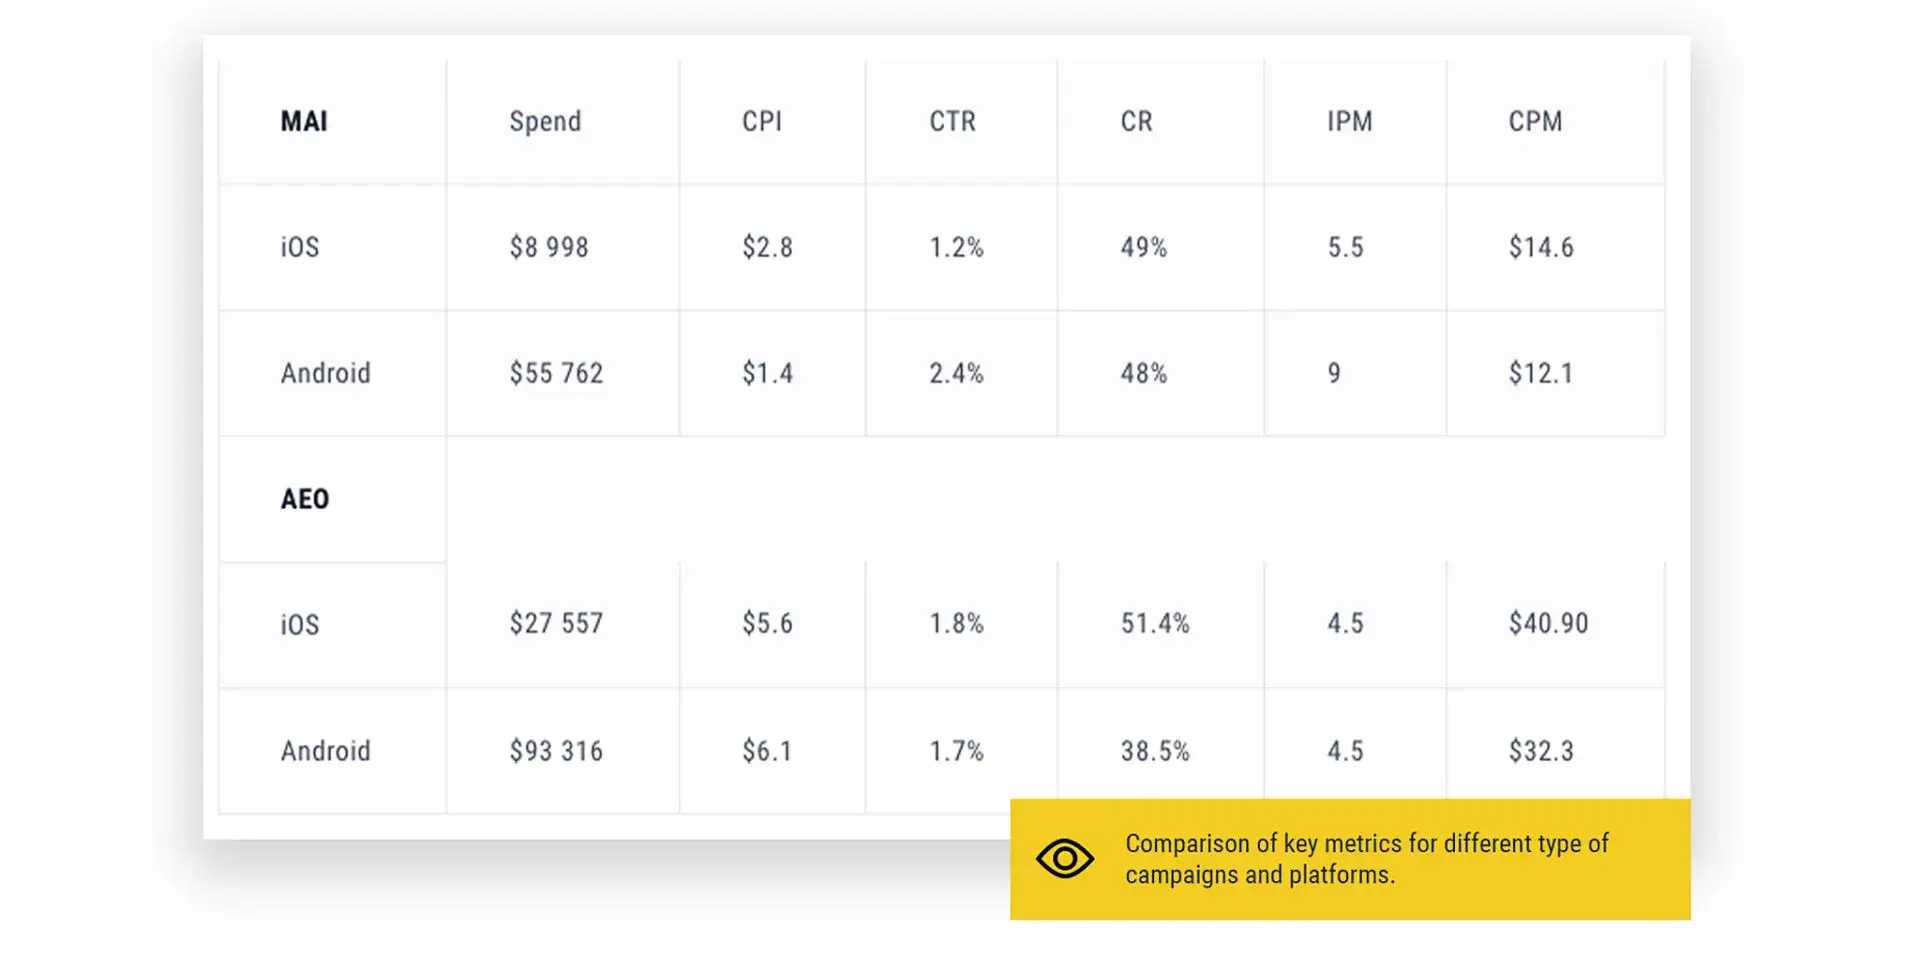
Creative testing with CPA campaigns: Though cost per action campaigns may exhibit impressive performance, they tend to be too expensive for efficient creative testing for mobile ads. Achieving the goal of 100 installs and 10K+ impressions is more effective with campaigns optimizing towards installs, which also aids Facebook in optimizing its algorithm faster. A second round of checks is necessary to ensure that the new winning creative indeed drives conversions, such as trials started and in-app purchases.
Is Facebook Ads Manager Better than an MMP Dashboard?
Once you obtain the initial campaign data, the first step is to check for consistency between Facebook reporting and your mobile measurement partner (attribution tool). In many cases, you may identify discrepancies that need to be addressed or thoroughly understood.
Facebook reporting typically provides swift results and enables you to define custom metrics like IPM (not a standard performance indicator).
Moreover, Facebook offers additional metrics such as 3-sec per impression rate, ThruView, Video average playtime, and the percentage of a video watched, which might not be accessible through your MMP via API.
On the other hand, attribution tools like Appsflyer and Adjust offer the advantage of allowing you to set custom conversion windows and other adjustments, which can better align with your evaluation methodology.
In summary, Facebook Ads Manager, MMP dashboard, and your own dashboard each have their own strengths and limitations. Deciding on the best solution for your individual needs or your team requires thorough exploration of all three options. None of them is significantly superior or inferior to the others.
Final Thoughts
Creative testing for Mobile Ads primarily takes place on Facebook and Android, with the insights gained then applied to the iOS platform.
At the outset, it is crucial to concentrate on testing a universal creative concept across all placements. Only when a dominant placement is identified should you proceed to adjust your creative strategy.
To ensure sufficient impressions (10K+) and installs (100) per each variant, new creatives testing must be conducted in separate ad sets, compelling Facebook to optimize effectively.
Evaluation of creatives should be conducted separately for each placement since user consumption patterns differ, leading to significant variations in metrics.
The key metric for assessment is the impression to mille (IPM), which combines ad click-through rate and store conversion.
Mobile Ad Creatives eBook
How to Design Ads and App Store Creatives
A comprehensive guide to designing thumb-stopping visuals that will grow your user base and revenue.


