This is part eight of the Mobile Marketing Creatives Series where we focus on conducting A/B test(s) in both App Store & Google Play . In ten episodes, we aim to provide insight and inspiration on creating thumb-stopping visuals to promote your app.
Download the Mobile Ad Creatives eBook today to read the other nine parts of this series. The comprehensive guide includes ten core topics condensed into a practical blueprint with examples from AppAgent’s Creative Team.
In this article, you will learn:
- How marketability testing can significantly enhance the chances of new product success.
- The various pros and cons associated with the four testing options available to mobile marketers today.
- The top ten A/B testing commandments we strongly recommend following to optimize your marketing strategies.
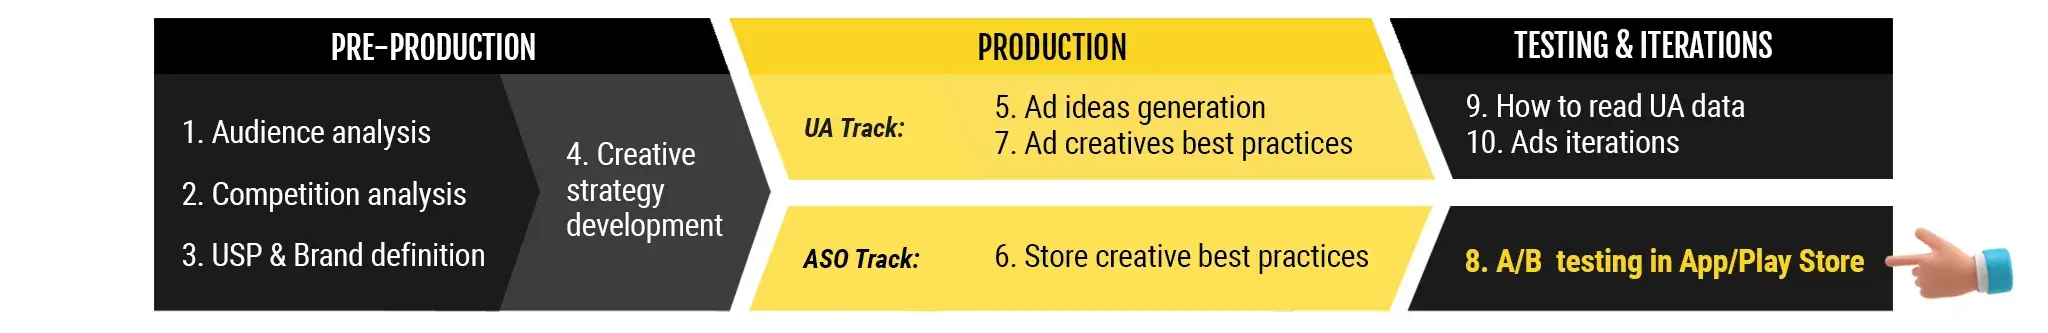
How to run A/B test in App Store
Store listing optimization is a powerful mid-funnel strategy that significantly enhances the performance of your paid and organic marketing efforts. Since most mobile app or game installs originate from the store page, the conversion rate impacts both organic and paid traffic.
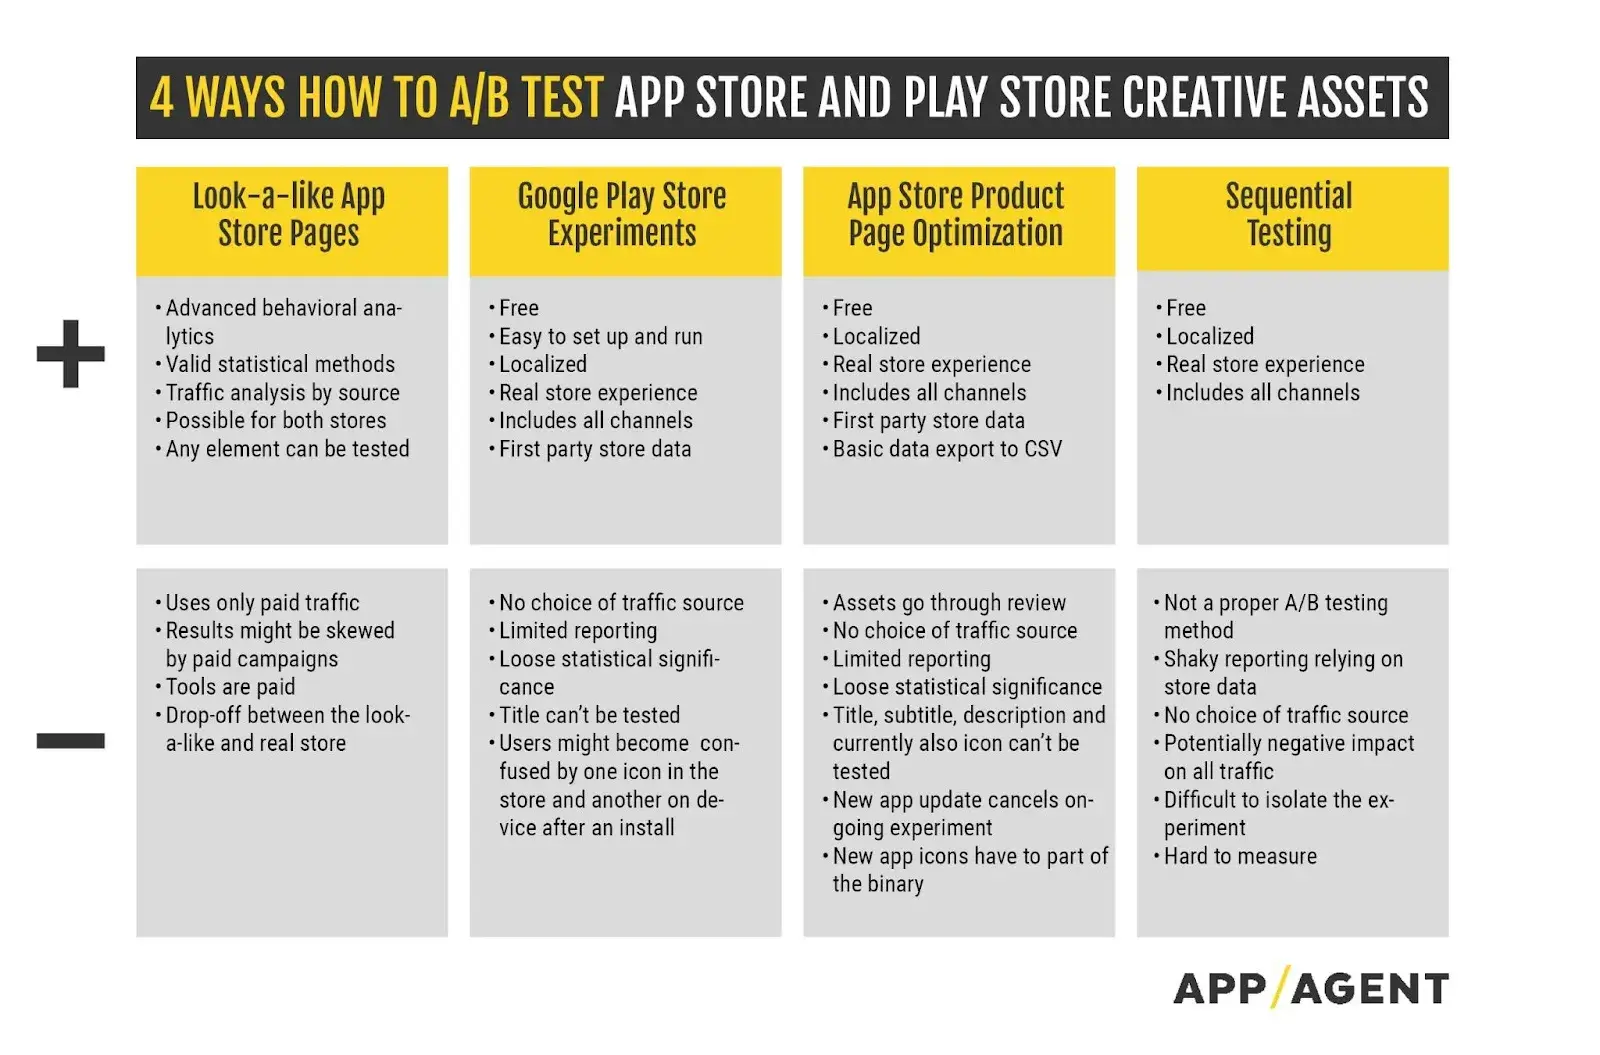
Currently, three effective A/B testing options are available:
- Look-a-Like App Store Pages – 3rd party, web environment
- Google Play Experiments – Android only, native
- App Store Product Page Optimization – iOS only, native
Alternatively, for iOS, you can utilize sequential testing on the App Store. Although not technically an A/B test, until recently, this method remained the sole approach to enhance the conversion rate on iOS.
Let’s take a look at each of these options in more detail.
1. Look-a-Like Pages
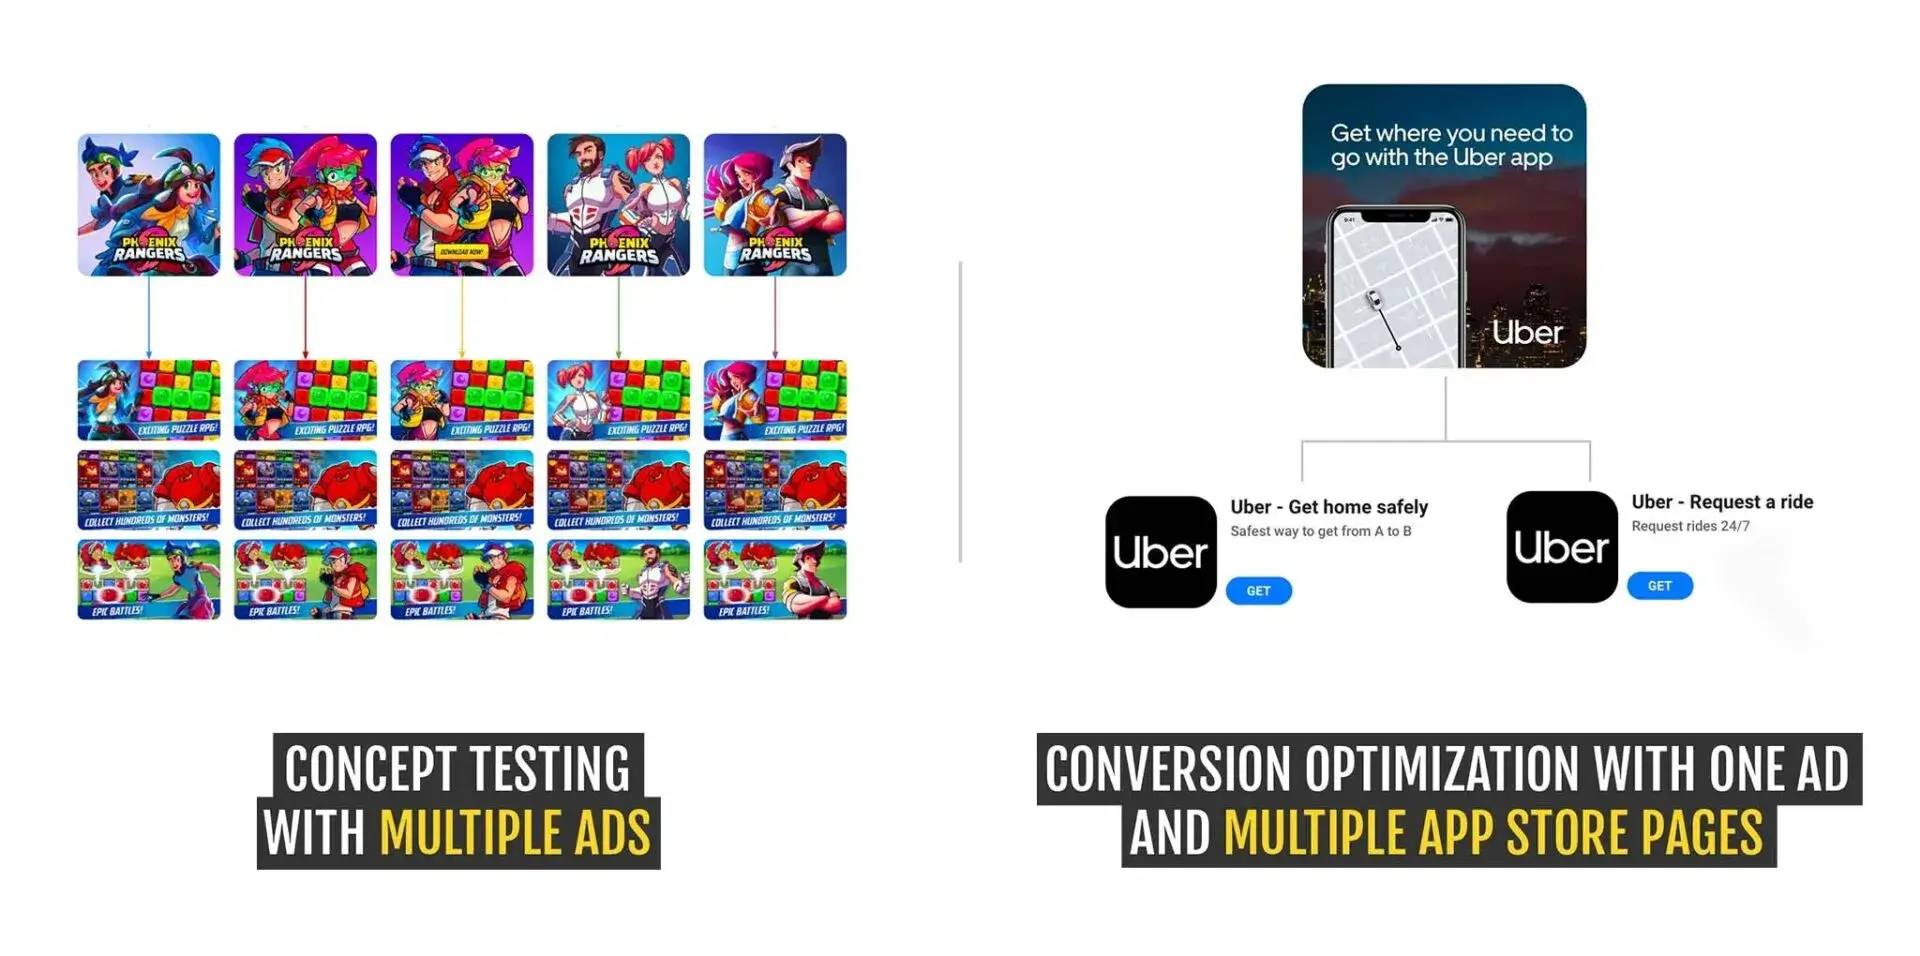
When testing through a look-a-like app store, you direct either owned or paid traffic to a web page that resembles the app store. This page is virtually identical to the real app store in appearance. You can direct owned traffic, for instance, from your website, or you can opt for paid traffic using platforms like Facebook Ads.
Upon clicking the ‘Get’ button, the user is forwarded to one of the following options:
- The real store, which will open the native app in the real App Store.
- A landing page.
- A survey revealing that it was merely an experiment.
Why opt for the look-a-like pages option in A/B testing? It serves as marketability testing, which involves a series of experiments for a pre-released app or game to validate market interest and refine crucial elements like the product proposition, game theme, and design look and feel, all before its official launch.
As Jesse Lempiäinen from Geeklab explains,
“Getting an initial sense of where your product concept and audience fit sits can be done as a stand-alone test between several ideas or by comparing your idea to a rival or a past effort.“
To give you a better idea of what can be tested, here are some suggestions from Jesse:
Theme testing: Explore themes such as zoo, ocean, wizards, candies, etc., to gauge the relevance and excitement they evoke among your audience.
Art testing: Determine which art styles resonate best with your target demographic.
Feature testing: Gain insights into which core game mechanic performs most effectively in terms of top-of-the-funnel metrics (e.g., merge vs match 3 vs 1010).
Motivators testing: Identify the primary drivers for your audience, whether they lean towards social interaction, mastery, or creativity.
Unique selling proposition (USP) testing: Define core communication points that set your product apart from others.
Marketability tests can be a time-saving measure by preventing further investment in a product that may not resonate with the market. With thorough market and design research, you can refine your product vision for an app or game within a few weeks, all before writing a single line of code.
An additional advantage of utilizing look-alike store pages is the valuable insights they provide into user behavior. You can gather valuable data on heatmaps, interactions with screenshots, video view rate, and more. This approach isn’t limited to start-ups; even established apps and games can benefit from generating valuable insights through this method.
Thanks to the power and accessibility of tools like Google Analytics, you can employ valid statistical methods to analyze traffic by source, gaining insights into the differences in user behavior from various channels, such as paid campaigns on Facebook, email newsletters, or your website. This allows you to make data-driven decisions and optimize your strategies accordingly.
Limitations of LOOK-A-LIKE PAGES
The drawback of look-alike pages testing is the need to acquire users through paid traffic. The nature of paid user acquisition used by the store, such as Facebook auction pool for weblinks or Google UAC, can result in different paid traffic behaviors.
Naturally, you’ll have to face the fact that some page visitors who click on the “Get” button might not proceed to the second step, the real app store.
While tools like Geeklab offer valuable insights, they come at a cost and often require a minimum commitment or contract length.
2. Google Play Store A/B Testing
Google Play Store A/B testing stands out as the most widely used method for A/B testing store assets. Its popularity can be attributed to its cost-effectiveness, simplicity in setup, and ability to provide first-party store data. It also offers a genuine store experience that includes all channels.
Every visitor to the store page, whether they are organic or paid users, contributes a valuable new data point to your experiment. This inclusive approach allows you to gather crucial insights regardless of the user’s origin.
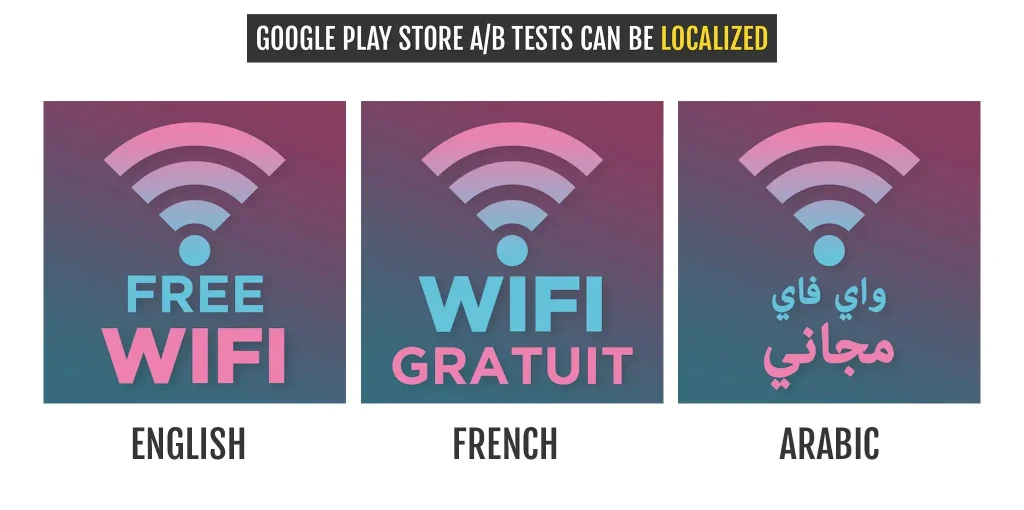
Google Play Store A/B tests offer the advantage of localization, enabling your text variants to be indexed accordingly.
At AppAgent, we find it beneficial to create custom store listings tailored to target specific groups of countries. By merging, for example, all English-speaking markets or the DACH region, you can conduct tests for each segment seamlessly. The result is a larger data set generated at a faster pace compared to running experiments in individual countries.
Limitations of GOOGLE PLAY STORE A/B TESTING
This option, however, has its limitations, as it is exclusively available for Android users. The reporting capabilities are also somewhat restricted.
Technically, the absence of deep links prevents proper post-install event measurement. Moreover, there is no choice of traffic source and no reporting based on Search, Explore, or Referrers.
In conclusion, Google Play Store experiments offer significant benefits, but there is one crucial aspect to consider. Martin Jelinek, AppAgent’s Head of Growth, highlights the catch:
“The biggest issue we have at AppAgent with Google Play experiments is the very loose statistical significance. Confidence intervals are extremely weak and often result in questionable outcomes, and the problem has been the same since 2015!“
To compensate for this, Simon Thillay, Head of ASO at AppTweak, recommends running A/B/B tests:
“Basically, you create an experiment with two of the same B variants (A/B/B rather than A/B). If in this case, both B samples provide similar results, you can be more confident of the impact of the uplift when implementing the variant.“
Learn about our approach to evaluating experiment results and mitigating false positives in the 10 commandments section at the end of the article.
3. A/B test for App Store Listing
With the iOS 15 update released in late 2021, you now have the ability to test an app’s product page using different icons, screenshots, and app previews to determine the most effective option.
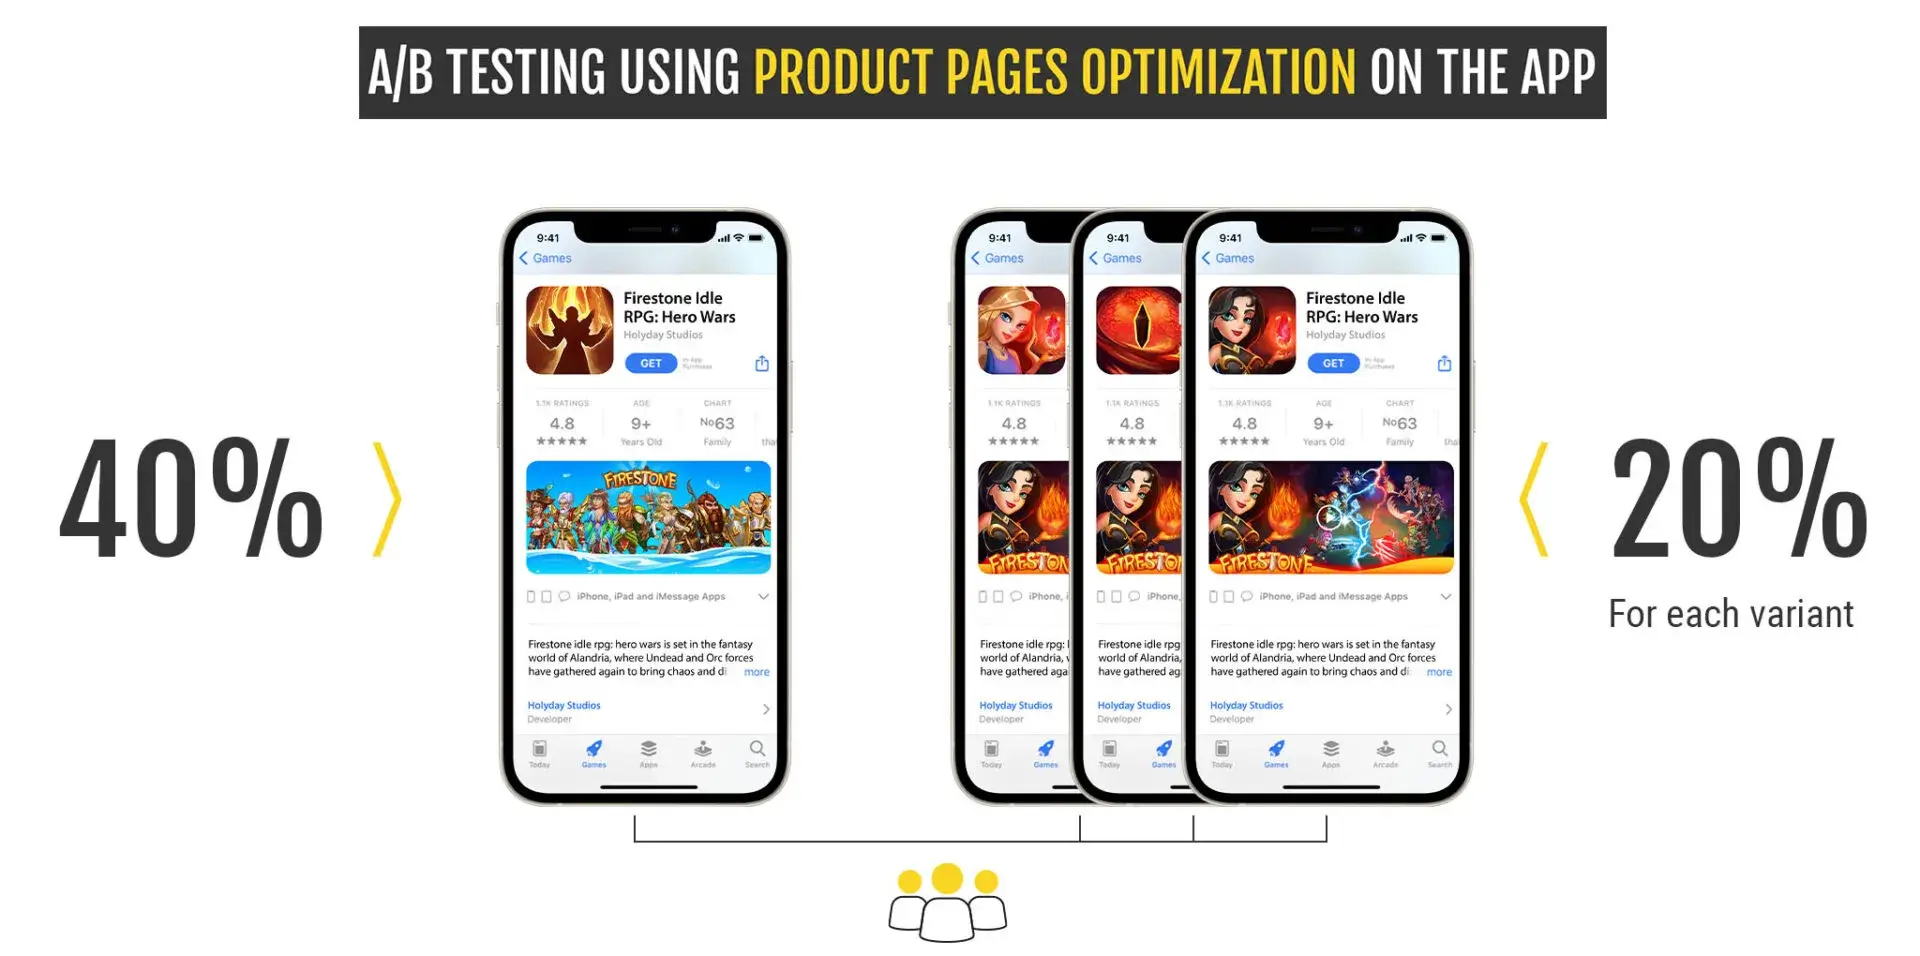
This feature, known as Product Pages Optimization (PPO), allows you to conduct tests with up to three new variants alongside the control variant within the native App Store environment, much like Google Play experiments.
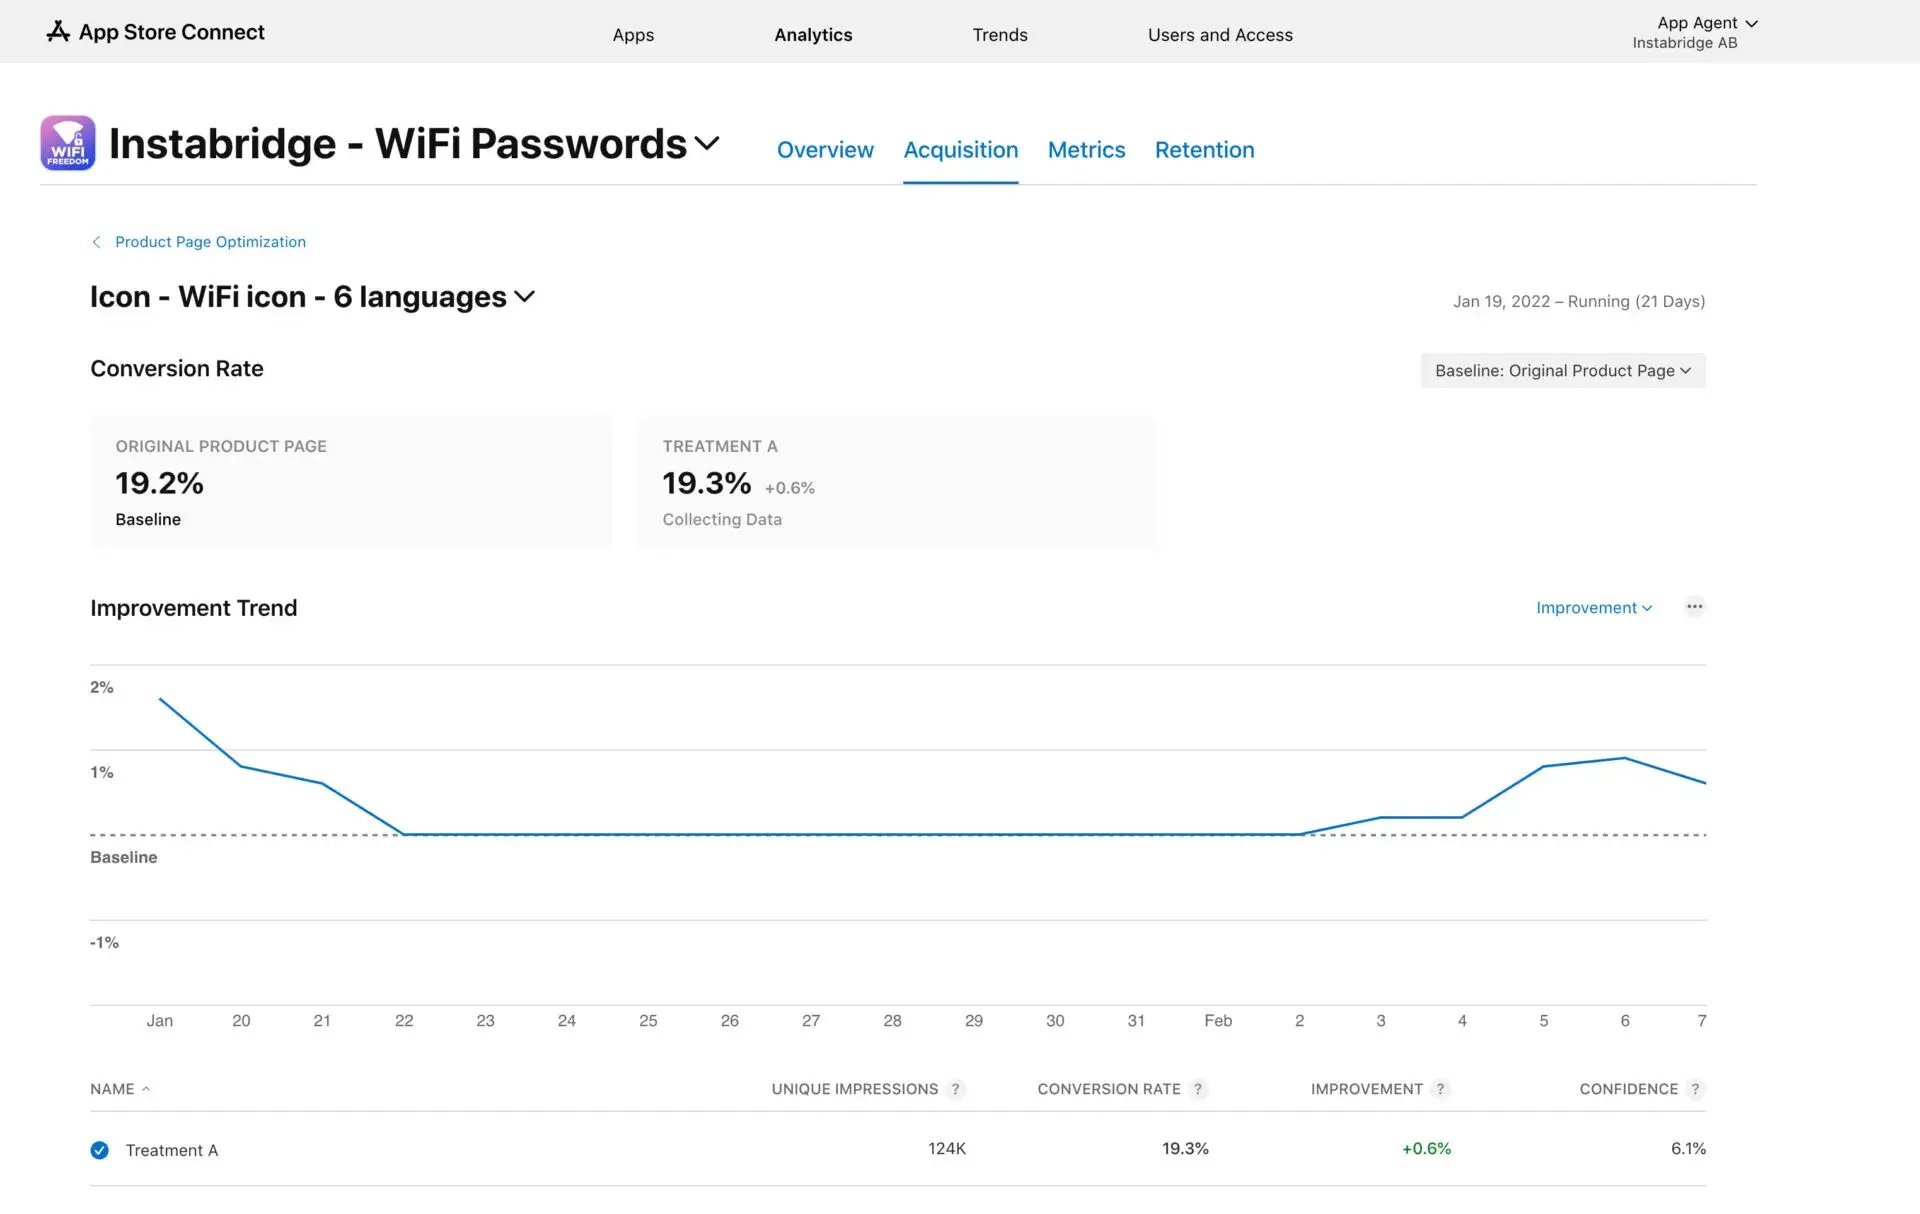
Each version under test is presented to a randomly chosen percentage of users in the App Store, and the outcomes are displayed in App Analytics. This test can be run for a duration of up to 90 days and within specific countries of your choice.
Limitations of APP STORE LISTING A/B TESTING
Unlike Google Play experiments, the testing on iOS is limited to visual elements, including the icon, screenshots, and app preview video.
It does not allow testing of the title, subtitle, and description. For testing icons, they must be incorporated in the app binary (see the guideline by ASO Giraffe).
In every product page optimization test, all creative assets must undergo the standard App Store review process. However, it does not necessitate a new app version release, except in the case of the app icon. The creative assets need to be part of the app binary code to ensure a consistent user experience throughout the test.
Apple, similar to Google, employs a 90% confidence interval for evaluating experiments. To assist with experiment setup, you have the option to specify your desired improvement in conversion rate. By utilizing your app’s existing performance data, including daily impressions and new downloads, an estimate of the experiment’s duration can be generated.
You can experiment with various factors, such as the number of tested variants (with a maximum of three) and traffic distribution, to optimize the expected outcome.
One advantage of PPO is its capability to export tests in CSV format, which proves beneficial for organizing backlogs. These backlogs are crucial for keeping track of past actions and the corresponding outcomes achieved. By leveraging historical data, you can more accurately assess the potential impact of similar experiments and prioritize future tests with greater effectiveness.
Currently, the export includes only the test name, start, and stop dates. However, in the future, we hope to see the inclusion of additional data that would facilitate better analysis and confidence calculation.
David Pertl, Growth Manager at AppAgent, adds an important insight:
“Unlike on Google Play, a new app version release cancels an ongoing A/B test. If you are updating frequently, you’ll have to carefully plan experiments and app updates.”
This flaw is just one of several issues that arose when the PPO was officially launched in January 2022.
Another drawback is that you are unable to set up and run more than one test simultaneously. Furthermore, when conducting a test across multiple countries (e.g., France and Germany), you cannot implement a new variant in one location only (such as just in Germany) while allowing the test to continue in the other (e.g., France).
Speaking of markets, you cannot segment analytical data by them when running tests in multiple countries. The workaround involves setting up separate tests for each market to obtain clear analytics. However, this approach results in extended testing periods due to fragmented traffic.
During the initial phase of this new PPO feature, some unexpected results have surfaced. Jiri Chochlik, Organic Growth Manager at Tilting Point, says:
“We’ve seen that two variants with similar impressions–over 100K each–and similar conversion rate, had different confidence of 22% and 90%, which is a huge difference.”
“On a positive note, changing the order of screenshots doesn’t require a review anymore, and instead goes live immediately (as opposed to new screenshots). The review time of new store assets without a new build is also much faster nowadays.”
To sum it up, only time will tell how committed Apple is to offering developers and marketers a robust tool to boost conversion rates and attract more users.”
For now, you can continue using the old-school sequential testing approach, wherein you replace one version of the store listing with another over time and measure the conversion uplift. However, this method comes with the challenge of keeping such experiments isolated from external influences and calculating the results with very limited data in the App Store Connect.
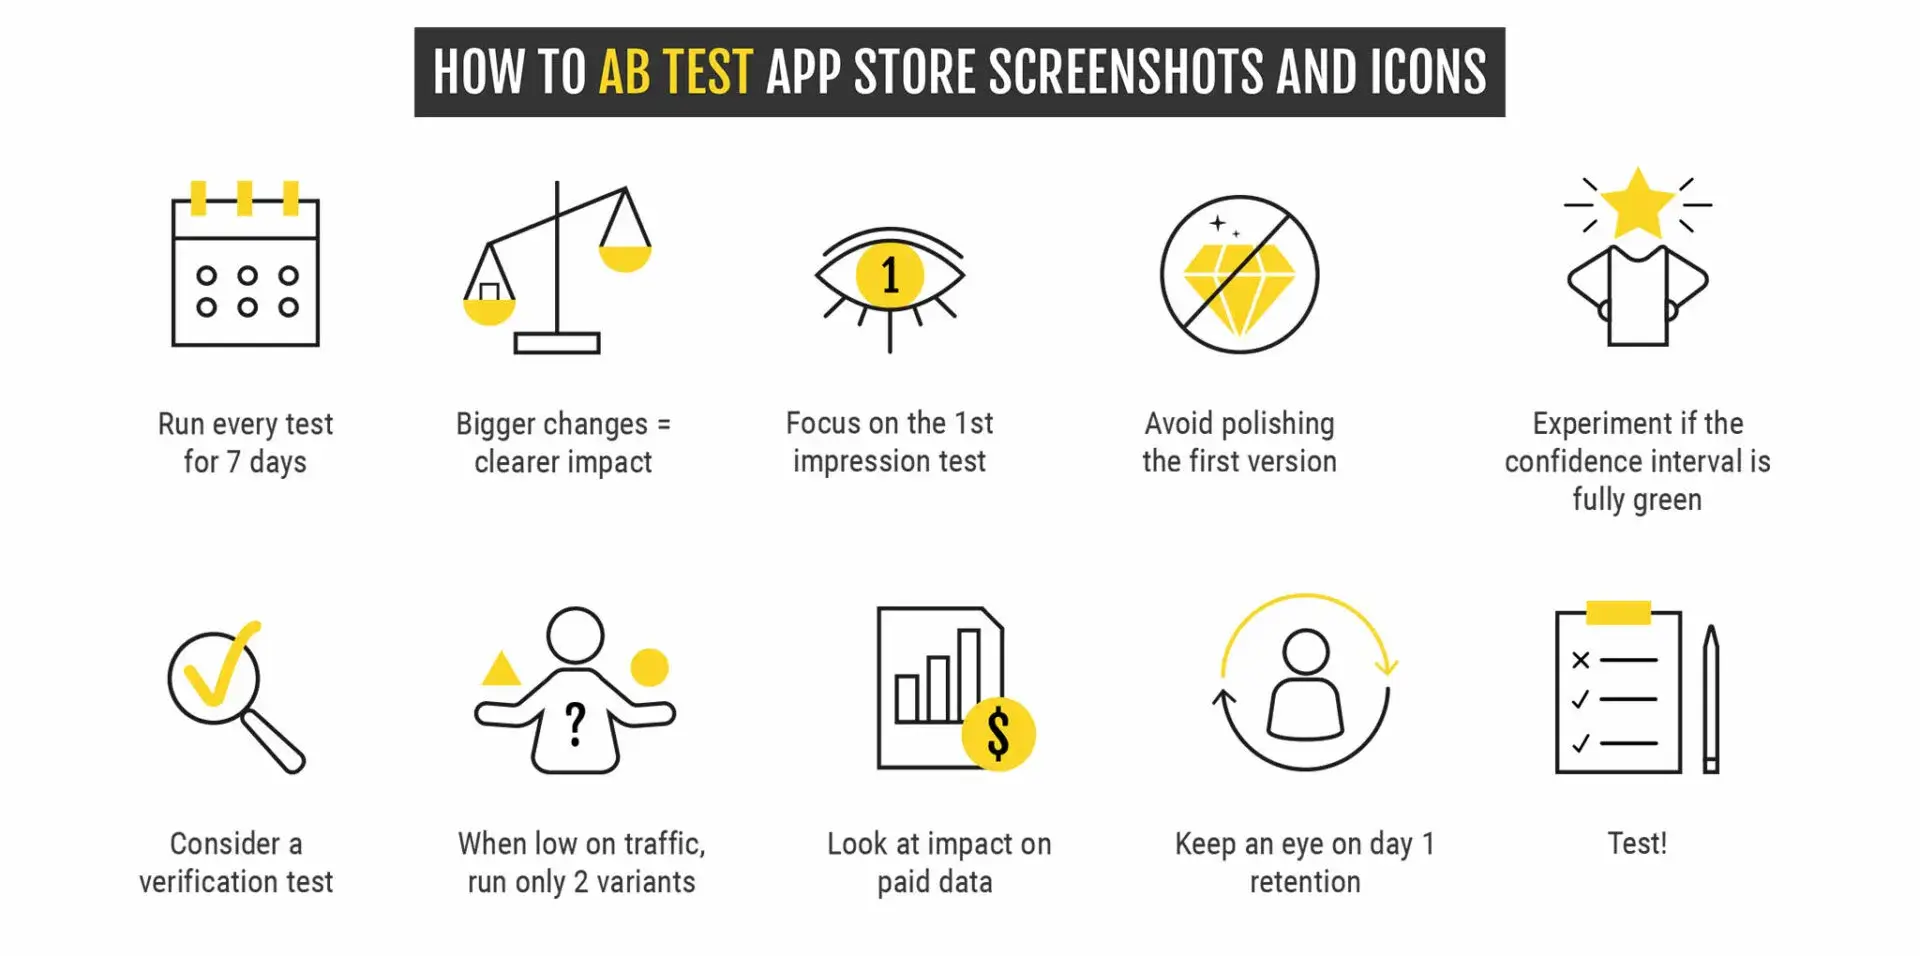
How to A/B Test App Store Screenshots and Icons
Having conducted successful store experiments for over seven years, we have established a set of 10 internal commandments that we diligently follow at AppAgent. By sharing this guide, our aim is to help you conduct and evaluate your A/B test for App Store effectively for any mobile app or game.
Run each test for a minimum of seven days or a multiple of weeks (e.g. two weeks vs. 17 days) to collect data from both workdays and weekends.
For clearer impact, make bigger changes; smaller tweaks require more tests to identify a winner, particularly for developers with low traffic or when starting with experiments.
Prioritize first impression tests as they have the most significant impact on user behavior.
Speed up testing volume by avoiding excessive polishing of the first version of new assets.
Consider experiments successful only if the confidence interval is entirely in the green zone and shows at least a 5% improvement (lesser improvements are often statistical errors).
For critical assets like icons or the first screenshot, consider a verification test (running the test multiple times, B/A test) to ensure accurate results.
In cases of limited traffic, run only two variants to obtain results faster and iterate accordingly.
If you have a higher media spend, assess the impact on paid data before, during, and after the test.
Monitor day-one retention after significant changes to your store presentation to verify that user expectations are being met after downloading.
Make the most of every opportunity to test and avoid wasting any time!
Final Thoughts
Over the past 2-3 years, ASO has evolved into a field primarily focused on conversion optimization rather than search optimization. The majority of search traffic now revolves around brand terms, making it challenging to scale.
In contrast, Conversion Rate Optimization (CRO) presents a significant lever that can have a profound impact on all traffic sources.
By enhancing the conversion rate from 20% to 25%, an app with an average of 100,000 monthly downloads can gain an additional 300,000 users each year. This substantial growth in free traffic not only boosts user acquisition but also leads to significant cost reductions in paid user acquisition.
Our advice: seize this opportunity to maximize your app’s potential and avoid leaving money on the table!