Mobile gaming is more competitive than ever. Studios pour budgets into user acquisition, watch installs climb, and still can’t make the numbers work. Revenue trickles in slower than expected. Margins shrink. The game that looked promising in soft launch fails to scale. You know the formula – LTV must exceed CPI – but knowing the formula and controlling it are different problems entirely.
The issue isn’t the math. It’s that most studios treat LTV > CPI as an outcome to monitor instead of a system to engineer. CPI is shaped by market forces. LTV is shaped by hundreds of decisions across game design, retention, monetization, and UA — many of them made before the game even launches. Without a structured way to think about these levers, teams chase low CPI at the expense of margin, or hit early ROAS targets that collapse over time.
This guide covers the strategic foundation for making LTV > CPI work in your favor – the principles, data practices, and business economics that need to be in place before any tactical lever matters.
The Core Equation: Why LTV Must Exceed CPI
Three terms anchor every profitability conversation in mobile gaming:
- LTV (Lifetime Value): The total revenue a player generates over their lifetime in the game.
- CPI (Cost Per Install): What you pay to acquire that player through paid ads.
- ROAS (Return On Ad Spend): LTV ÷ CPI. ROAS must be above 100% for a campaign to be profitable.
That’s the formula. As Roberto Sbrolla, AppAgent’s Head of Growth, puts it in the foreword to The LTV > CPI Playbook: knowing the formula isn’t enough. Success requires foundational knowledge and the ability to control the key levers that impact both sides of the equation.
The Playbook organizes those levers into a 17-component framework structured in three sections: Foundation, Before Launching the Game, and Once the Game is Published. Components are grouped as either Enablers (foundational areas of knowledge — strategy, data, business economics) or Levers (tactical actions across UA, creatives, ASO, retention, monetization, virality). Each component either drives LTV up or brings CPI down. The framework works as a checklist regardless of where you are in your game’s lifecycle.
This article focuses on the Foundation: the three Enablers that set the conditions for everything else.
Strategic Principle 1: It’s a Marathon
Balancing LTV and CPI is a never-ending pursuit. Arriving at launch with a developed competitive advantage is what separates studios that scale from those that grind. The Playbook is direct on this point: a strong competitive advantage should be developed even before your game goes live, and you should define well in advance how you’ll compete. Luck doesn’t scale — a plan does.
The Playbook identifies three places to build that advantage.
Competitive Advantage in CPI
CPI advantages start with understanding your audience before writing a line of code. Magic Tavern’s Project Makeover is the canonical example. Zack Zhao, Magic Tavern’s CEO, attributed the studio’s approach to user behavior analysis: gamers preferred dramatic storylines, and TV-show themes had not been built into puzzle games. Magic Tavern translated that insight into both the game design and the creative strategy. Their attention-grabbing, soap-opera-style ads kept CPI low enough to scale past 100M+ downloads on Google Play (source: The LTV > CPI Playbook, citing a Think with Google article).

Their understanding of player motivation improved the entire acquisition funnel, from ad click-through to long-term engagement.
The takeaway: market research feeds creative strategy, and creative strategy is where CPI advantages compound.
Competitive Advantage in LTV
The hypercasual market — historically dependent on in-app advertising (IAA) only — is shifting toward hybrid monetization. Layering meta mechanics on top of a hypercasual core boosts retention and activates in-app purchases (IAP). As CPIs continue to rise across the market, this hybrid approach is becoming a baseline requirement for hypercasual studios that want to stay competitive.
Competitive Advantage at the Company Level
Not every advantage lives at the game level. Studio-level specialization can drive costs down across an entire portfolio. FunCraft focuses exclusively on word games and runs 15+ titles with a 14-person team. Specialization enables reusable code, faster feature implementation, and cross-promotion across games — which simultaneously cuts costs and lifts engagement and retention. Word Yatzi and Wordgrams are two outputs of that strategy.
Strategic Principle 2: You Control LTV More Than CPI
This is the mindset shift that’s hardest for many studios to internalize.
CPI is largely market-driven. Genre benchmarks set the floor, seasonality moves it, and competitive pressure during peak periods does most of the rest. You can influence CPI through creative and targeting, but you don’t own it.
LTV is different. LTV is shaped by decisions the development team makes across three levers, and those decisions compound over time:
- Game Design (Pre-Launch). A compelling gameplay loop, engaging mechanics, and well-balanced difficulty.
- Retention Strategies. Social features, live events, and a steady flow of fresh content to keep players coming back.
- Monetization Optimization. Aligning IAP, ads, and premium content with player behavior — without hurting retention.
Prioritize them in that order. The Playbook puts it bluntly: if your game suffers from poor retention or monetization, it’s a leaky bucket, and no amount of paid UA will yield positive ROAS.
Fix the fundamentals first before scaling your efforts.
The Data Foundation: Analytics, KPIs, and Understanding the CPI and LTV Relationship
Strategy sets direction. Data tells you whether the direction is working. The Playbook calls out three data practices that every studio needs.
Set the Right UA Budget to Maximize Margin
LTV being higher than CPI isn’t enough. The margin has to be large enough to support scalable user acquisition. CPI tends to rise as spend increases — and at scale, you may start acquiring lower-value users with degraded LTV. Both effects compress margin in the same direction.
The connection between margin and UA budget is less obvious than it looks. To generate the same $10,000 margin at different ROAS levels, ad spend changes dramatically:
| ROAS (D120) | Margin | Required Ad Spend |
| 105% | $10,000 | $200,000 |
| 125% | $10,000 | $40,000 |
| 160% | $10,000 | $16,700 |
| 200% | $10,000 | $10,000 |
| 250% | $10,000 | $6,700 |
Higher ROAS increases your capacity to generate profit while keeping acquisition costs sustainable. Set the UA budget with margin optimization in mind, accounting for CPI increases and potential LTV degradation as you scale. Paid UA must be self-sustaining — the incremental impact of paid UA on organic growth is diminishing, so don’t budget on the assumption that organic will subsidize paid.
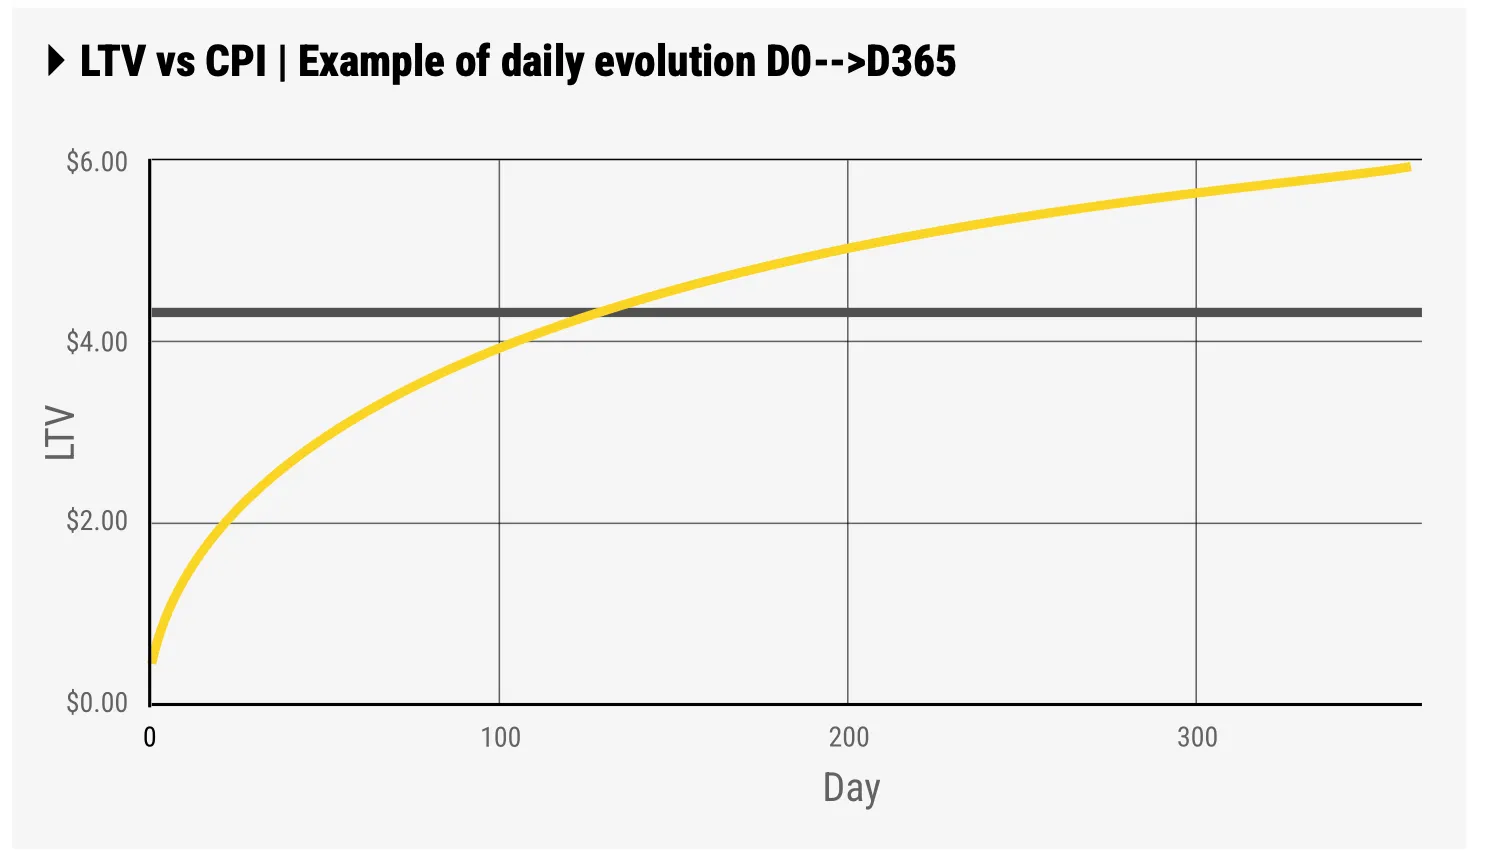
Visualize and Predict LTV Over Time
LTV is a function of time. It must always be referenced within a specific timeframe – “LTV at Day X.” On Day 1, you know CPI for the cohort acquired on Day 0, but you don’t yet have a reliable LTV estimate (unless it’s a hypercasual game with aggressive monetization).
This creates the question every UA team eventually has to answer: when will LTV exceed CPI?
LTV prediction is the answer. Teams combine retention rates, ARPU trends, early monetization signals, and cohort behavior to forecast long-term player value. It lets the UA team make spending decisions with confidence, spot trends early, and refine forecasts over time. From AppAgent’s data audits across multiple game studios, a recurring finding is that teams underestimate long-term LTV – leading to missed revenue opportunities.
A common limitation: Mobile Measurement Partners (MMPs) restrict access to long-term data. The fix is to own your data in your own database, with a solid LTV progression model and segmentation strategy. With that infrastructure in place, the Playbook flags two examples of smarter decisions a studio can make: prioritizing FTUE improvements that affect every player above monetization tweaks that impact only a few high-spenders, and developing dedicated monetization strategies for VIP players to capture deeper revenue potential (such as adding a web store).
For a deeper breakdown of LTV calculation, segmentation, predictive modeling, virality, and recoup curves, read our guide to calculating LTV in mobile games.
Tracking LTV month-over-month and week-over-week isolates the effects of seasonal fluctuations (holiday-driven spikes), product updates (new FTUE or new ad placements), UA strategy shifts (bid or budget changes), LiveOps events (a new tournament), and featuring impact (such as a ‘Game of the Day’ feature on iOS).
A Growth Manager or Product Manager should own LTV as a core business metric – building LTV curve visualizations, monitoring profitability KPIs, evaluating cohort performance, and refining models as new data and product updates emerge.
CPI itself also deserves a closer look. The Playbook cites AppsFlyer’s State of Gaming App Marketing 2024 on broader CPI trends: Android CPI increased by 48% from Q1 2023 to Q2 2024, and while iOS CPI dropped significantly over the same period, it still runs roughly 3.5x higher than Android on average. Several factors drive these fluctuations: seasonality (with higher costs during holiday periods), market demand (publishers competing for inventory), and creative effectiveness (ad performance and conversion rates).
ROAS is a strong indicator of the LTV–CPI relationship, but breaking CPI down further provides deeper insight. Decompose it: CPI = CPM ÷ IPM.
CPM (Cost Per Mille) reflects market demand and ad inventory costs. IPM (Installs Per Mille) measures creative performance and conversion rates. Monitoring both diagnoses, whether CPI changes are market-driven (CPM fluctuations) or creative-performance-driven (IPM variations) – a distinction that matters when you’re deciding whether to adjust bidding or commission new creatives.
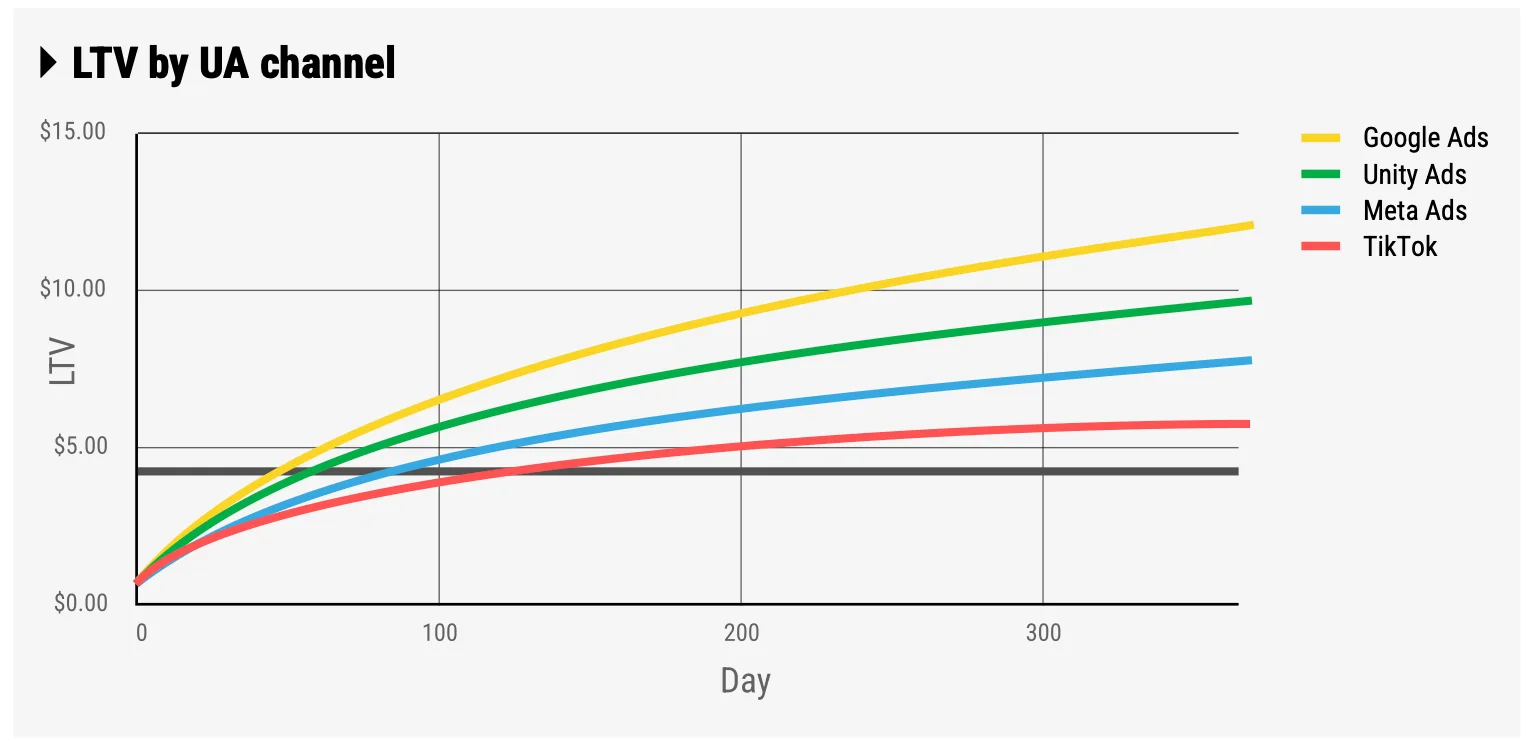
Get a Multidimensional View of Lifetime Value
A single LTV curve is not enough. The Playbook documents that different UA channels (Google Ads, Unity Ads, Meta Ads, TikTok) produce significantly different LTV curves, and the same applies within a single UA channel based on platform, geography, and campaign type. LTV varies significantly across:
- Platform (iOS vs. Android)
- Geography (regional spending behavior differs sharply)
- Media sources (Google Ads, Meta, Unity, TikTok all produce different curves)
- Campaign types (CPI vs. tROAS)
- Device type — frequently overlooked, often material
High-end device owners typically have greater spending capacity, which translates to higher IAP value and LTV. Testing monetization on Android in a market dominated by low-end devices (e.g., India) will produce different signals than testing on iOS, where premium devices are more common and often correlate with higher purchasing power. Some developers test monetization on iOS first for this reason.
On the UA side, device type should factor into acquisition strategy: comparing tablets vs. smartphones, analyzing device manufacturers and models in Unity Ads, and excluding low-performing devices in campaigns where appropriate. Be mindful that limiting targeting may impact scale.
The goal of a multidimensional view is budget reallocation based on ROAS results across these dimensions — directing spend toward the cohorts that justify the cost.
Business Economics: Payback Time and Cash Flow
Strategy and data set the stage. Business economics determines whether the studio survives long enough to use them.
Understanding Payback Time
It’s not just about achieving LTV > CPI – it’s about when. Since CPI is a daily constant for a given cohort, the first day on which LTV ≥ CPI defines your payback time.
Typical payback times by genre (as documented in the Playbook):
- Hyper-Casual: 2–7 days
- Hybrid-Casual: 7–60 days
- Casual: 2–6 months
- Mid-Core & Hardcore: 6 months – 2 years
Shorter payback periods let studios reinvest earnings into UA or product improvements without relying on external funding. Longer payback periods increase dependence on large upfront investments and make scaling riskier and less sustainable.
Why the Monetization Shape of the LTV Curve Matters
Reaching payback is one thing. Getting there faster is another. The steeper the LTV curve, the healthier your cash flow. A game with 50% D7 ROAS is in a far stronger position than one with 17% D7 ROAS – faster revenue recovery means more available capital for UA reinvestment, reduced reliance on external funding, and lower financial risk.
This is why early monetization strategy matters so much: optimizing initial IAP offers and deciding when to introduce ads directly shapes the slope of the LTV curve. The Playbook references AppsFlyer’s State of Gaming App Marketing 2024: the first week is critical for in-game purchases, and on iOS, 25% of buyers make their first purchase by Day 2 and another 17% by Day 3. Each day brings new spenders, but at a decreasing rate – meaning the early window does most of the work.
Avoiding Financial Pitfalls
Many studios fail not because of poor game design, but because of mismanaged financial planning. The Playbook lists four common mistakes:
- Ignoring payback time dynamics
- Underestimating margin needs
- Setting unrealistic UA budgets
- Poor cash flow management
Mobile game scaling requires significant UA investment, and financial missteps drain resources fast. Each of these mistakes compounds with the others – underestimating margin leads to over-aggressive UA budgets, over-aggressive UA budgets accelerate cash flow problems, and cash flow problems force decisions that ignore payback time dynamics. The pattern repeats across studios that didn’t make business economics a first-class concern.
As a studio director, you either own business economics yourself or delegate it, but ensuring this enabler is in check is non-negotiable. Paid UA requires money, and the studio that doesn’t review payback time, cash flow, and margin systematically is the studio that runs out of runway before the LTV curve has time to do its work.
Frequently Asked Questions About LTV vs CPI
A profitable mobile game should maintain an LTV that exceeds CPI with enough margin to support scalable user acquisition. While a ROAS above 100% technically means profitability, most studios need significantly higher margins to absorb CPI increases, platform fees, operational costs, and long payback periods. The ideal ratio depends heavily on genre, monetization model, and growth strategy.
CPI is largely influenced by external market forces such as competition, seasonality, and ad inventory demand. LTV, on the other hand, is shaped by product and growth decisions that studios control directly — including game design, retention systems, monetization strategy, LiveOps, and player experience. Improvements across these areas compound over time and can significantly increase long-term profitability.
Studios use LTV prediction models built around early cohort behavior, retention trends, monetization patterns, and historical benchmarks. By analyzing metrics like D1, D7, and D30 retention alongside early ROAS signals, teams can estimate future LTV curves and make faster UA decisions without waiting months for complete lifecycle data.
As budgets increase, studios often exhaust the highest-performing audiences first and begin competing for broader or more expensive inventory. This raises CPMs and can reduce creative efficiency, which lowers IPM and increases CPI. Scaling also tends to introduce lower-intent users, which may negatively impact overall ROAS if LTV does not grow proportionally.
Payback time determines how quickly a studio recovers acquisition costs from revenue per user. Faster payback improves cash flow, reduces financial risk, and allows studios to reinvest revenue into growth sooner. Games with long payback periods require more upfront capital and are generally harder to scale sustainably without external funding.
Retention is one of the strongest drivers of LTV because players who stay engaged longer generate more opportunities for monetization through ads, in-app purchases, subscriptions, and LiveOps participation. Poor retention creates a “leaky bucket” where acquisition spend is wasted on users who leave before generating enough revenue to offset CPI.
Each UA channel attracts different player behaviors, engagement patterns, and spending profiles. Players acquired through Meta Ads, Google Ads, TikTok, or Unity Ads may vary significantly in retention, monetization, and long-term value. This is why experienced growth teams evaluate profitability not just by CPI, but by channel-specific ROAS and cohort-level LTV performance.
ROAS measures the relationship between LTV and CPI by calculating how much revenue is generated for every dollar spent on acquisition. In mobile gaming, ROAS helps studios evaluate whether campaigns are profitable, how quickly they recover acquisition costs, and whether UA can scale sustainably over time.
What’s Next
This is the foundation. Strategy, data, and business economics are the three Enablers – the structural conditions that determine whether the tactical levers (UA, creatives, ASO, retention, monetization, virality) can be effective at all. Without them, every tactical optimization is built on sand.
The full 17-component framework continues into pre-launch (market research, marketability testing, game design) and post-launch (the six tactical levers studios use to push LTV up and CPI down once the game is live). Each lever has its own deep-dive worth running through, but none of them produce sustainable results until the foundation is in place.
Need help auditing your LTV > CPI position? Let’s talk.
Want to see how this plays out in real campaigns? See our case studies.