You spent the budget. The installs came in. But by Day 7, half the cohort is already gone.
We see this pattern constantly. Teams sharpen creatives and push spend higher, only for those hard-won gains to leak straight back out. When a product fails to hold players, mobile game retention rates aren’t just a product strategy problem but an expensive cash drain that turns user acquisition into a leaky bucket.
The dangerous part is that your early numbers can still look healthy. D1 ROAS looks strong, D7 ROAS clears targets, and CPIs remain efficient, prompting teams to scale with confidence. Months later, however, the payback window stretches, LTV underdelivers, and business growth quietly stalls.
To protect your growth margins, you must evaluate your performance against the right app retention benchmarks – not a pooled global average, but a metric scoped to your specific genre, platform, region, and acquisition channel. This benchmarks report breaks down where public datasets disagree, how to interpret your metrics, and how to execute a data-driven retention strategy.

Three Realities of Retention Analysis
Before diving into the data, here are three core operating principles for your growth team to avoid low user retention loops:
- Averages are deceptive: Benchmarks swing hard by game genres, platform, region, and acquisition channel. Compare yourself to a pooled global average and you will reach the wrong strategic conclusion almost every time.
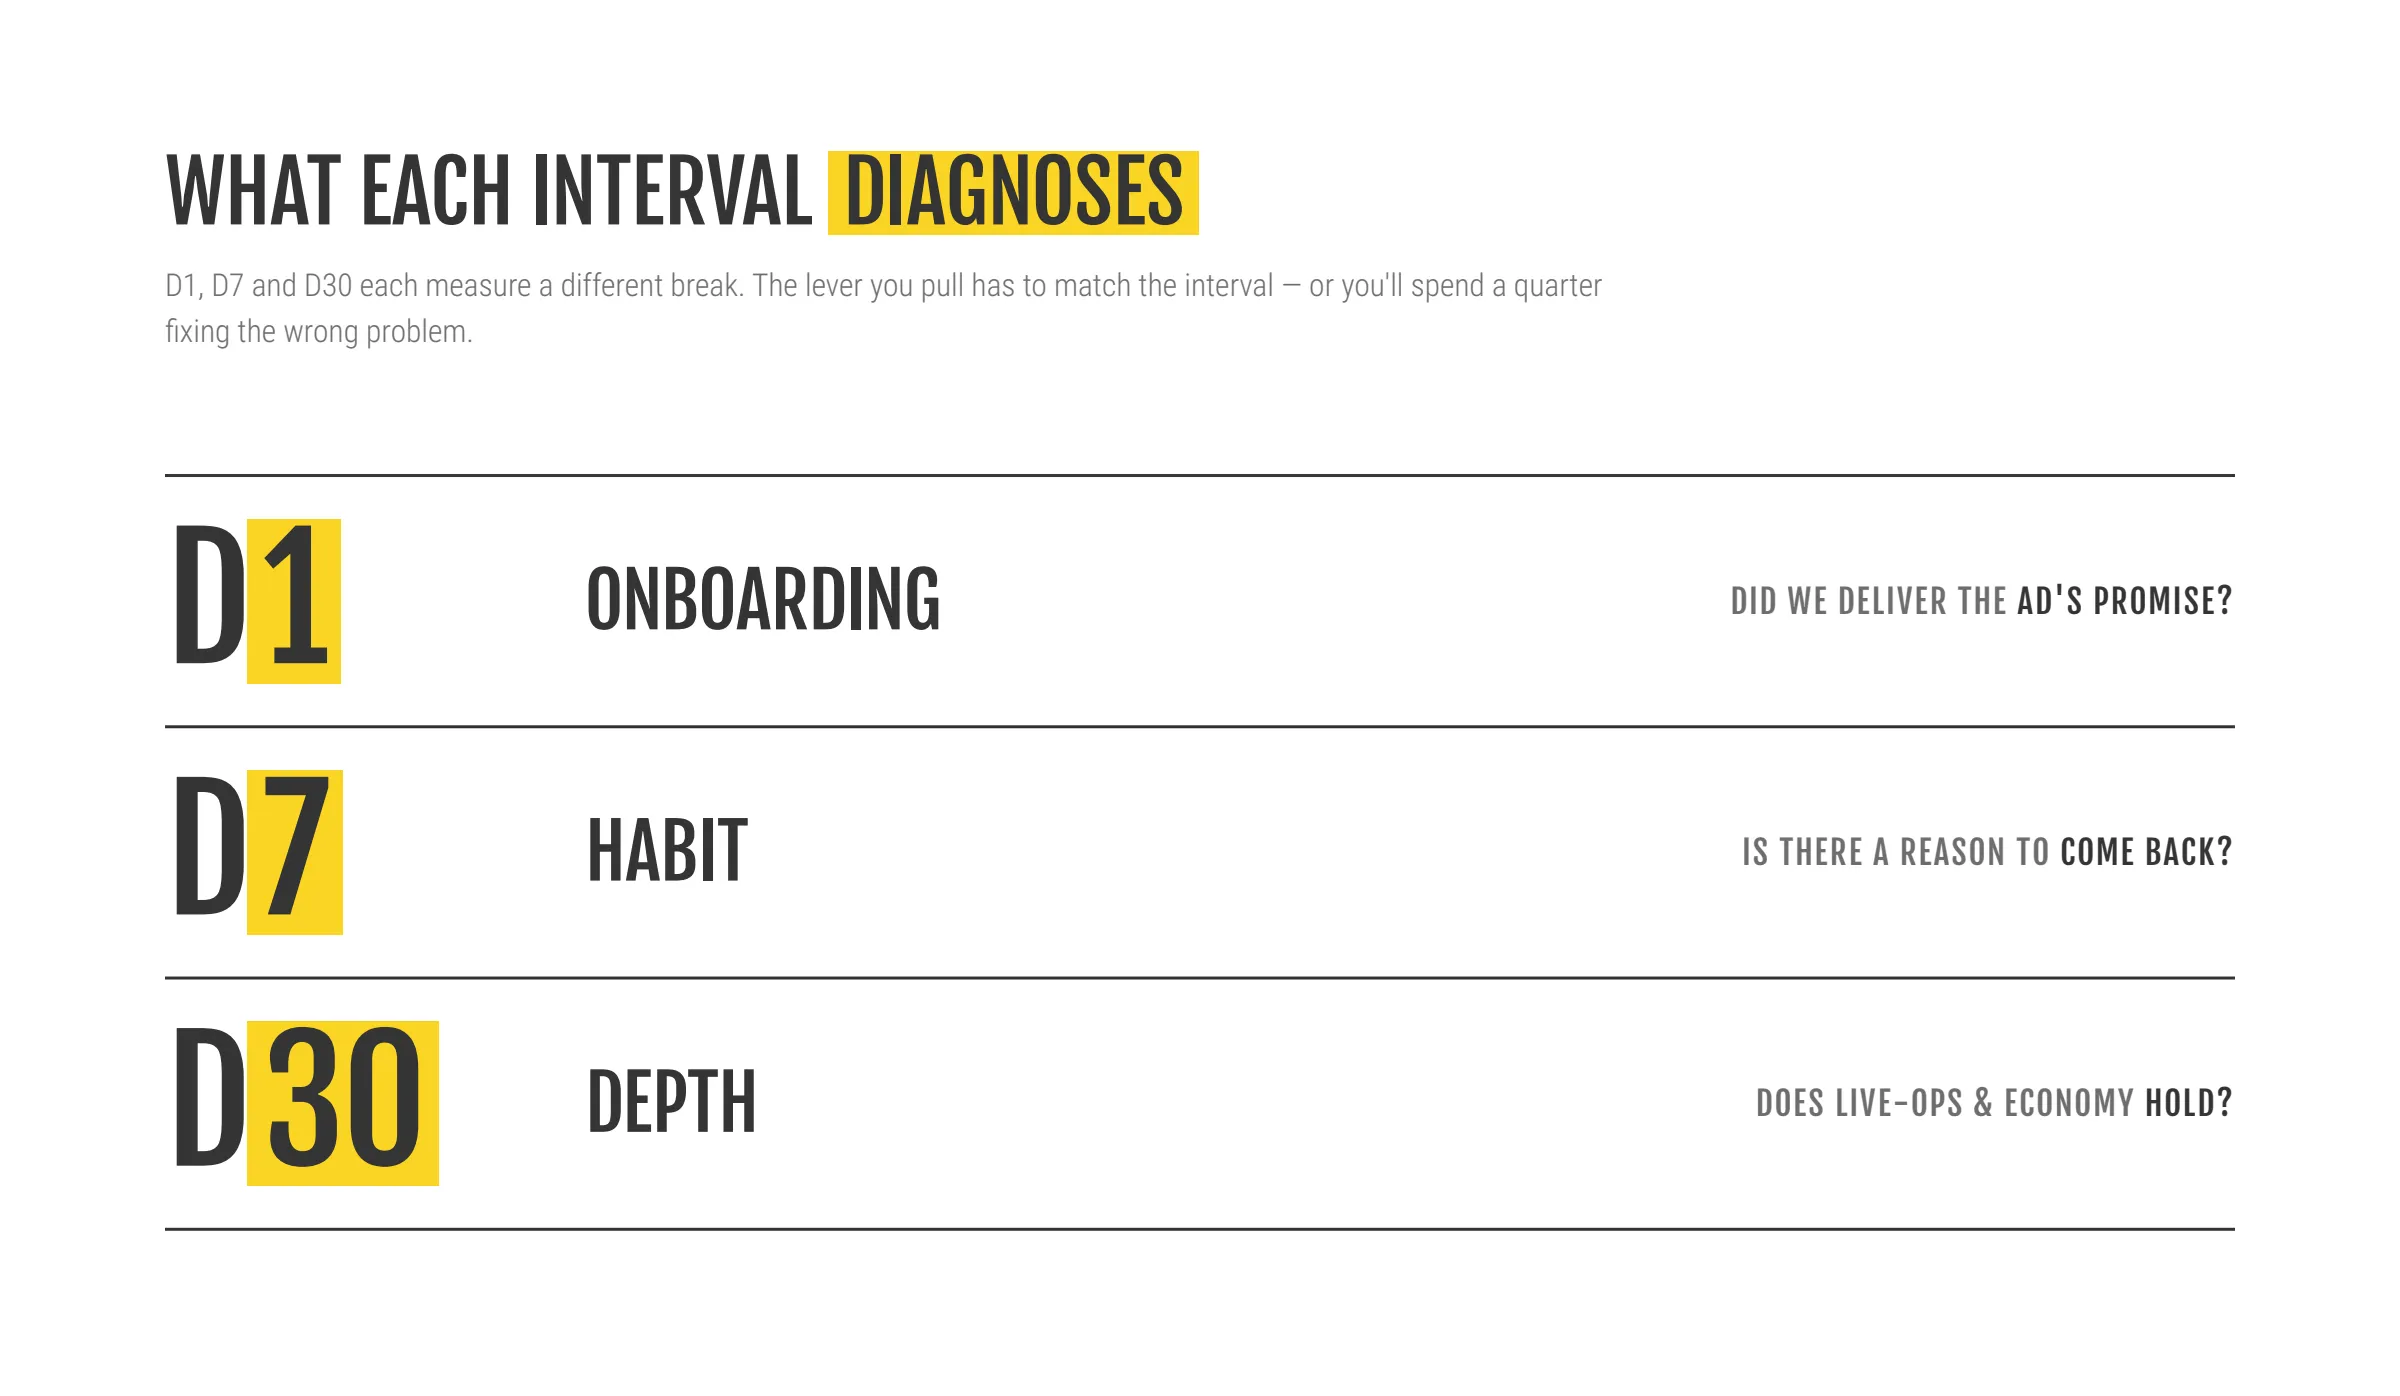
- The interval diagnoses the leak: D1, D7, and D30 each diagnose a different structural break. A weak D1 is usually an onboarding or expectation problem. A drop at D7 is a player habits problem. A weak D30 is a depth and live ops problem. Throwing creative budget at a long-term churn problem won’t save your curve, nor will reworking your core economy fix a broken onboarding experience.
- Early ROAS lies: A cohort can hit strong D7 ROAS while the underlying retention curve is already collapsing. Early ROAS rewards fast monetizers, not durable ones. That cohort may never reach the D30, D90, or D180 LTV the model originally projected.
What Is Mobile Game Retention, and Why Does the Benchmark Matter?
Mobile game retention benchmarks are standardized reference points that measure the percentage of users who return to a game at specific intervals after their initial installation date.
To evaluate game performance, retention is tracked at fixed intervals to measure ongoing player commitment:
- D1 Retention measures the first-session user experience: Did the game deliver on the promise the ad made?
- Day 7 Retention measures habit formation: Did the player find a reason to come back once the novelty faded?
- D30 Retention measures long-term engagement: This is where monetization depth, progression systems, and live ops separate strong products from weak ones.
Different retention drops point to different problems. Teams often lose months solving the wrong one. Throwing more creative budget at a weak D30 curve does not fix the issue, and reworking the economy because D1 slipped usually misses the real cause too. The lever has to match the interval.
Retention rate for mobile is the metric that connects UA spend to LTV. A below-benchmark average retention rate means every dollar spent on acquisition loses value faster than it should, turning your spend into an expensive cash drain.
Why benchmark reports disagree
This is the part most benchmark articles skip. There is no single “industry retention benchmark” because public sources measure entirely different populations of games.
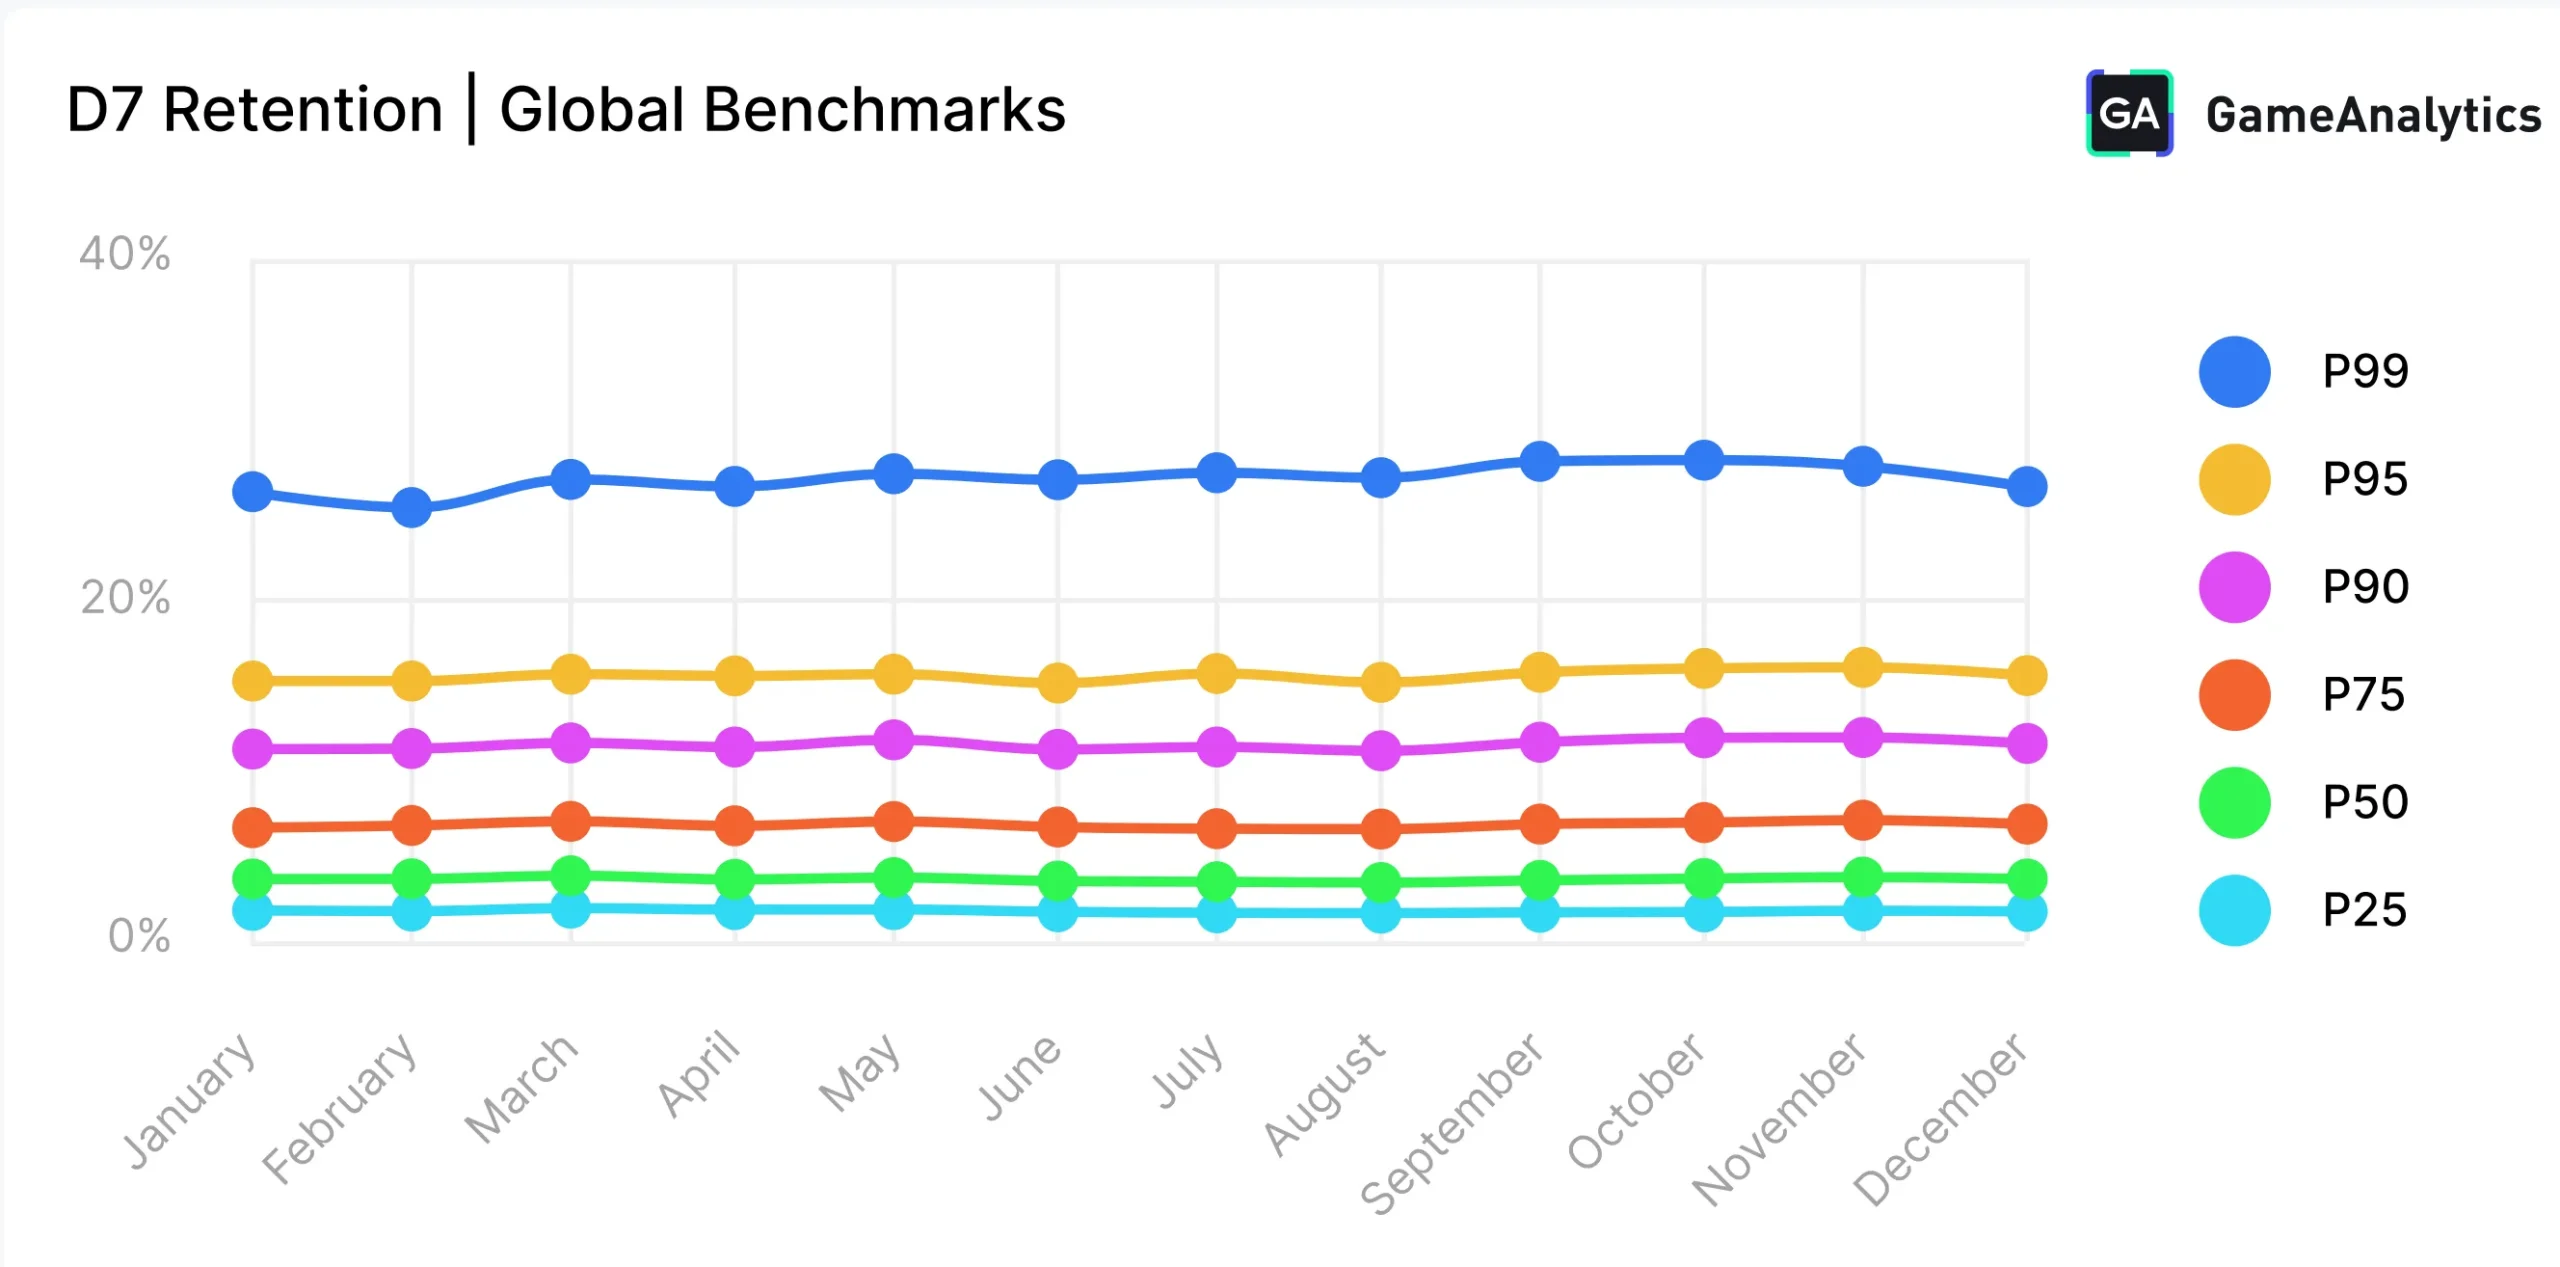
Some reports aggregate user data from thousands of titles across regions, platforms, and genres. These datasets include a large share of smaller or indie games, which naturally pulls the median lower. For example, GameAnalytics’ 2025 benchmark pools 11,600 games across 9 regions and 16 genres, yielding a median D7 across that entire pool of roughly 3.4% to 3.9%.
Conversely, other datasets focus strictly on commercially scaled titles running active user acquisition campaigns across networks like Meta, TikTok, AppLovin, or Unity. These benchmarks sit significantly higher because they reflect games with mature growth infrastructure, deeper monetization, and stronger live ops. Neither benchmark is wrong; they simply measure different ecosystems. A UA-funded strategy game on iOS should benchmark itself against commercially scaled titles, not against a broad average app or general mobile app benchmarks.
Why D1 and D7 ROAS Can Point Teams in the Wrong Direction
This is one of the most expensive mistakes we see. Early ROAS is comforting. You buy a cohort, D1 looks healthy, D7 clears target, and the campaign scales. But early ROAS rewards fast monetizers, not necessarily durable ones. A cohort can hit strong D7 ROAS while the retention curve is already collapsing underneath it.
The reverse happens too. Some of the highest-quality cohorts monetize slowly early on while retaining exceptionally well long-term. This is especially common in strategy and mid-core games where monetization depth compounds over time. If teams optimize too aggressively toward early ROAS signals, algorithms eventually prioritize low-quality users who monetize quickly but churn fast.
Retention is what keeps the economics honest. In AppAgent’s BELLEMINT launch work, aligning creative messaging, down-funnel event optimization, and the real in-game experience contributed to a +29% uplift in Day 7 retention on paid channels, alongside stronger ROAS performance. Most LTV models are built on retention assumptions that no longer reflect market reality. If your D1 assumption came from 2022 or 2023 casual data, it is likely 4 to 6 percentage points too high, and that error compounds at D7 and again at D30. Eventually, the projected payback never materializes.
That is why we look beyond CPI and early ROAS. The two numbers that matter most are:
- LTV-to-CAC Ratio: The healthy target is roughly 3:1. A 1:1 ratio is merely breakeven (acceptable only as a short-term land-grab), while ratios above 5:1 suggest you are underinvesting in growth. Mid-core and casino titles tend to run higher, while hypercasual frequently struggles to clear 2:1. Note: Use CAC, not CPI, as CPI only covers media costs, whereas CAC adds creative production, tools, agency fees, and team costs.
- Payback window: The payback window matters just as much. A game recovering CAC in 30 days behaves very differently from one taking 180 days to break even. The longer the window stretches, the more capital stays locked inside cohorts that have not yet broken even, which is real money that has to sit in the system at all times. Weak retention quietly extends both problems.
One caution: use CAC, not CPI. CPI is only the media cost. CAC adds creative production, tools, agency fees, and team. Track blended CAC for the whole business, but judge channels on paid CAC, because blended numbers hide weak paid performance behind free organic installs.
General Mobile Game Retention Benchmarks (2026)
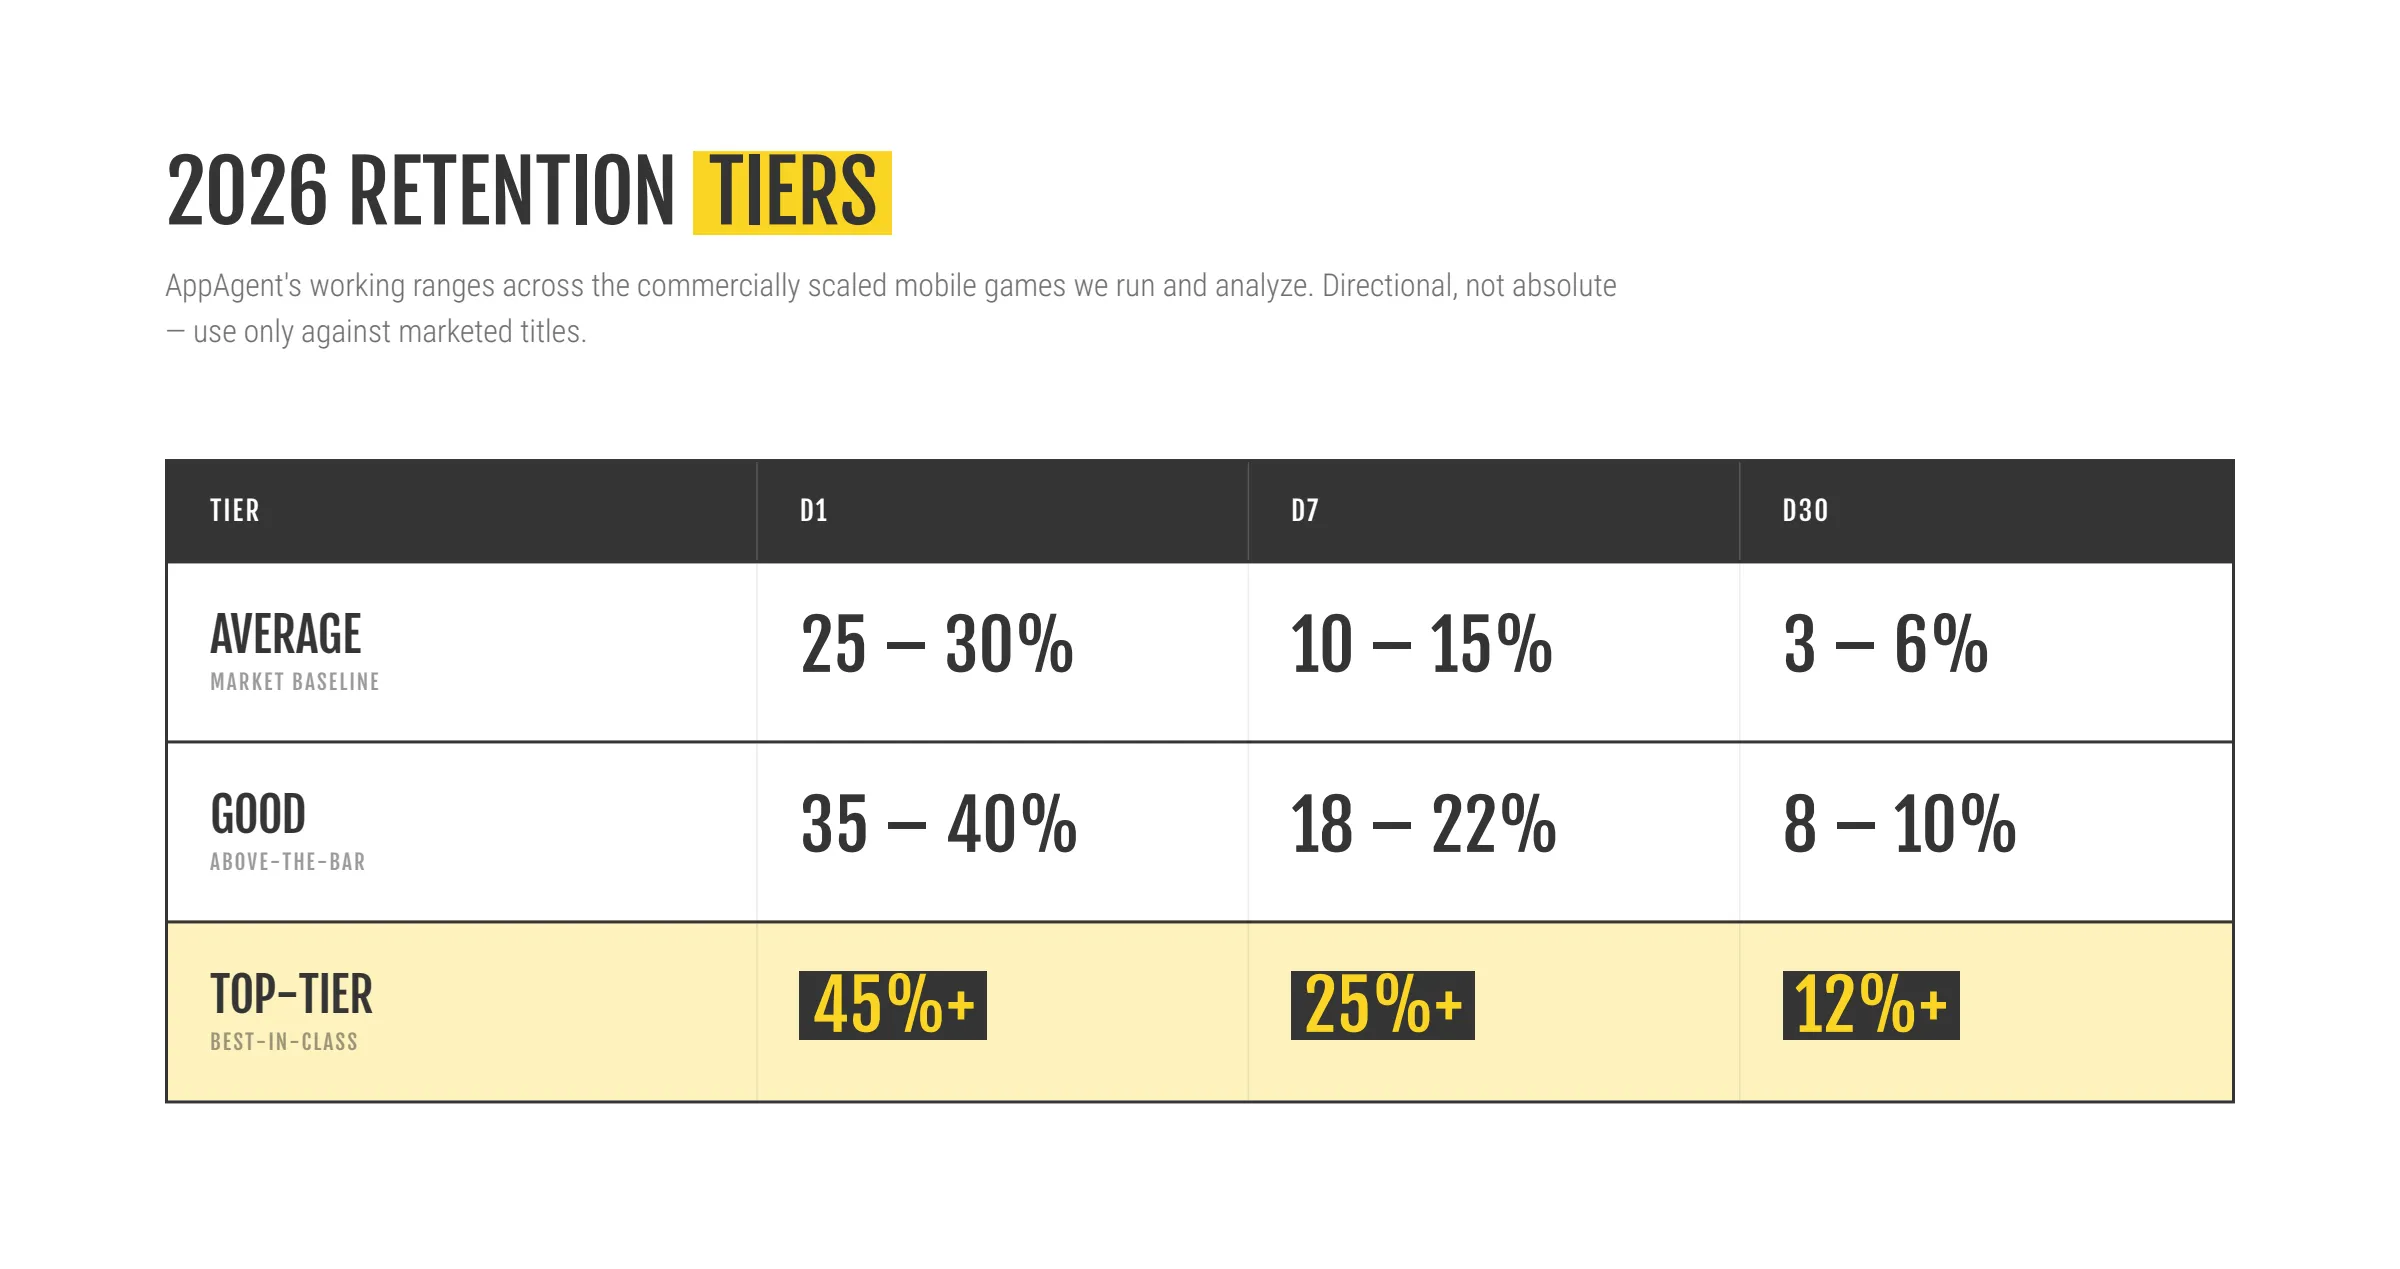
The tiers below are AppAgent’s working reference ranges, drawn from the commercially scaled games we run and analyze. They are directional, not absolute targets. They sit toward the higher, marketed-title end of the public data rather than the all-apps median, so use them only if you are benchmarking a commercially marketed game.
Average Retention Rate at D1, D7, and D30
| Retention Interval | Average Tier | Good Tier | Top-Tier |
|---|---|---|---|
| Day 1 retention | 25% to 30% | 35% to 40% | 45%+ |
| Day 7 retention | 10% to 15% | 18% to 22% | 25%+ |
| Day 30 retention | 3% to 6% | 8% to 10% | 12%+ |
Across almost every market source, day 30 retention has been getting significantly harder to sustain. Competition for attention is increasing, players cycle through games faster, and global mobile install growth has slowed sharply – Sensor Tower reports global app downloads grew just 0.8% in 2025. Hitting an average good retention rate today is materially harder than it was a few years ago.
Direct Takeaway: If a marketed title falls below a 3% D30 retention rate, the issue is rarely just creative or targeting. In most cases, it points to a fundamental product, progression, or live ops problem.
Mobile Game Retention Rates by Genre
Genre is the first variable to control; comparing a hypercasual game to a strategy benchmark produces noise, not insight, because the business models are fundamentally different.
- Hypercasual Games: These titles rely on minimal onboarding friction and instant gameplay, leading to strong early numbers. Sensor Tower puts top hypercasual D1 at 38% to 40%, though they suffer from sharp long-term drops due to reliance on very short payback windows.
- Casual Puzzle: This genre sits in the mid-range of standard benchmark expectations.
- Mid-Core and RPG Games: These categories operate in reverse to hypercasual, accepting higher onboarding complexity because long-term monetization relies on social loops, alliances, and deep mechanics. Sensor Tower places mid-core at 44% to 45% D1, 20% to 21% D7, and 11% to 12% D30, outperforming casual across every window. A strategy game with mediocre D1 can still become a strong business if its D30 and payer curves remain healthy.
- Idle / AFK Titles: These products frequently post long-term numbers that match or exceed RPG profiles at the D7 and D30 marks.
- Classic Sub-Genres (Card, Casino, Puzzle, and Board): GameAnalytics finds these to be the strongest performers for medium and long-term retention. While their onboarding may look unremarkable and arcade games lead them on D1, familiarity and habitual play patterns create stable long-term curves.
Find your actual genre tier first, then evaluate your numbers against it, never against a pooled global average. Holding a hypercasual game to a strategy benchmark is one of the fastest ways to misread a healthy product.
The category you buy into is a difficulty setting
Before you even open a campaign, the genre you are competing in sets how hard your UA economics will be. This is a CEO-level decision, not just a UA one.
Sensor Tower’s 2026 benchmarks data highlights this via the gap between where ad spend goes and where revenue actually sits. In the US in 2025, Lifestyle and Puzzle pulled 56.2% of all gaming ad spend while generating 41.3% of in-app-purchase (IAP) revenue. Casino was the mirror image: 10.4% of spend for 21.6% of revenue. Action and strategy sat roughly balanced at 30.7% spend against 34.8% revenue.
When a category’s share of spend runs well above its share of revenue, the auction is overcrowded and you are paying a premium the revenue pool does not justify. When spend share sits below revenue share, there is room to acquire efficiently. The spend-to-revenue gap is one of the most underused signals in UA planning, and it belongs in the room when leadership picks which genre to back.
There is a second structural force: Eastern publishers grew IAP revenue by $2.58 billion in 2025 while North American publishers fell by $1.78 billion. The reason is monetization depth. A competitor whose product generates $5 of lifetime value per install can bid $3.50, win the user, and profit. If your product generates $2, you cannot follow them without losing money. This is a monetization problem disguised as a UA problem; the answer is to raise your LTV ceiling, not to keep outbidding into a loss.
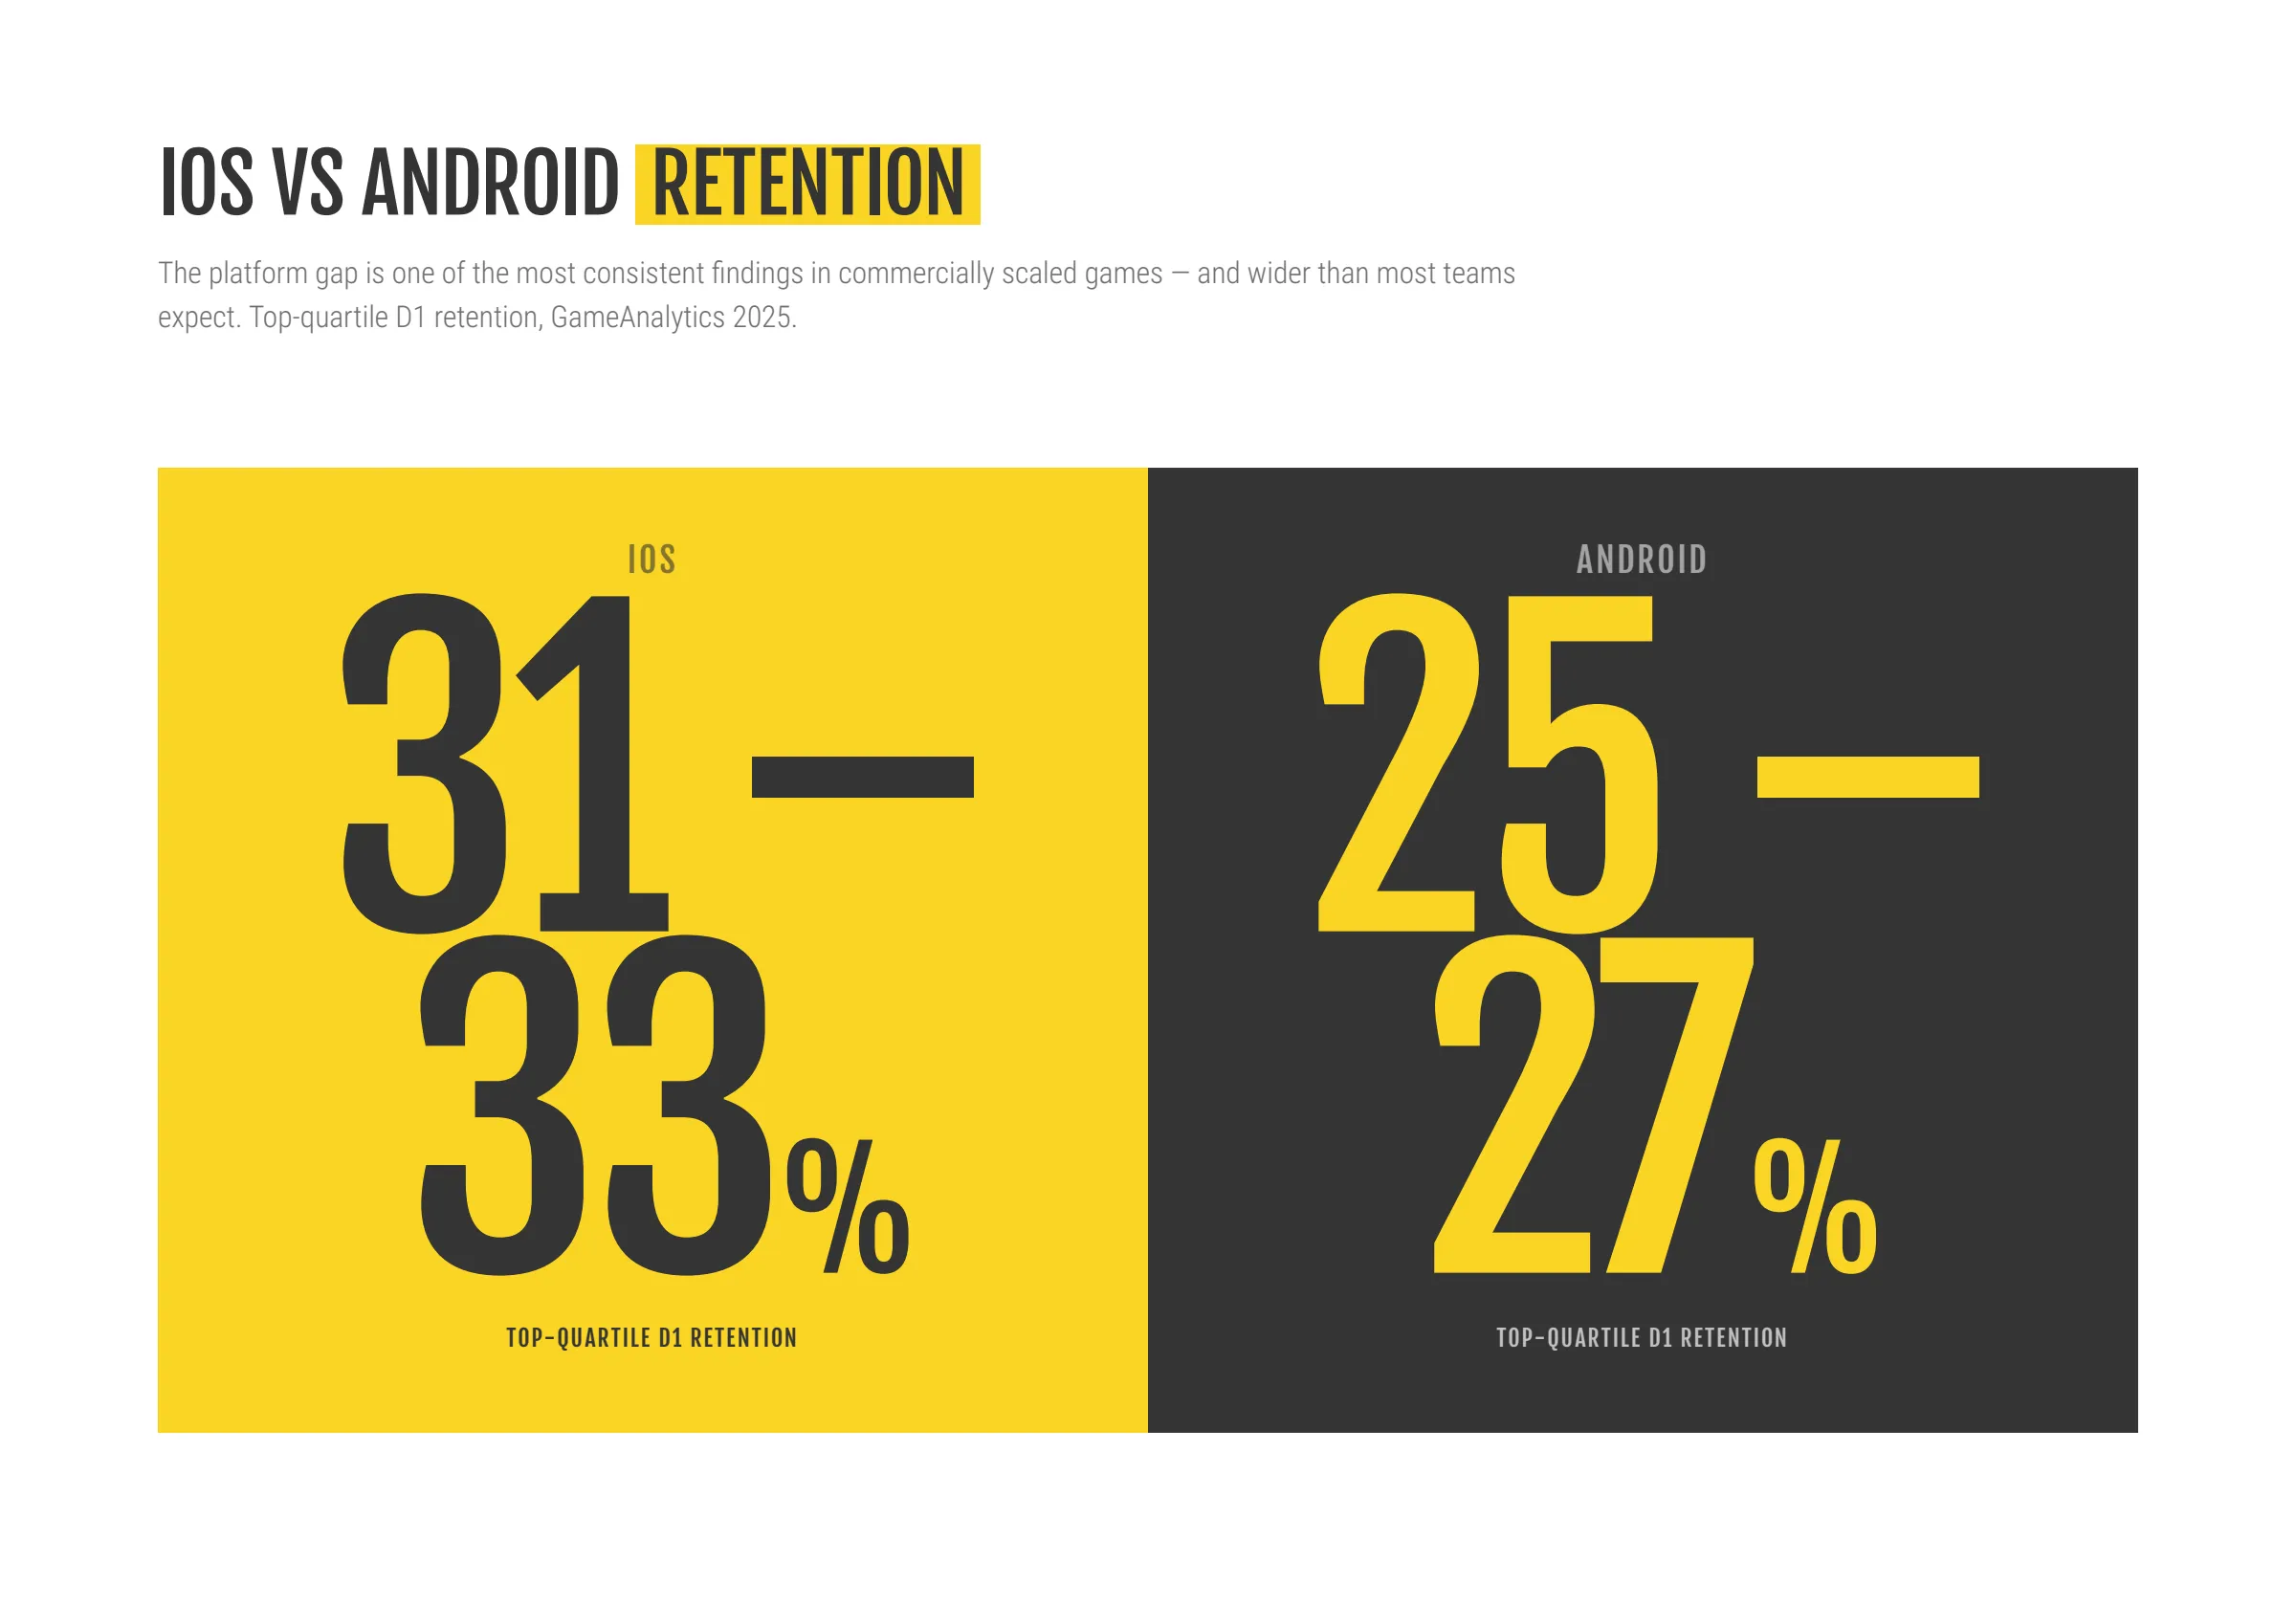
Mobile Game Retention Benchmarks by Platform: iOS vs. Android
The rate of mobile engagement varies significantly across ecosystems. The iOS versus Android gap is highly consistent and wider than most teams expect, making it critical to examine iOS and Android rates independently. GameAnalytics data shows that iOS consistently retains better across most genres, posting top-quartile D1 retention of 31% to 33% compared to Android’s 25% to 27%.
This data is not an argument to abandon Google Play traffic, which still delivers massive global scale and carries an attribution advantage that allows faster UA optimization. Instead, it highlights the need for platform-specific retention tactics because the engagement levers behave differently:
- On Android: Push notification opt-in rates are structurally higher, but individual open rates are lower. Interestingly, Android players actually run more sessions per day than iOS players, completely inverting the standard retention picture.
- On iOS: The initial notification opt-in window is smaller, but players who do opt in choose to re-engage in loops at a meaningfully higher rate.
If your blended dashboards look soft, split your retention metrics by platform before drawing any conclusions.
Retention by Region: Where Geography Changes the Numbers
Geography introduces enough variance in mobile game retention that a global average can actively mislead a team.
GameAnalytics’ pooled data puts the Middle East at the top across all three windows, at 22.64% D1, 4.91% D7, and 1.49% D28. In this region, classic categories—particularly casino and word games—dramatically outperform all other genres. Europe and Oceania also perform strongly, anchoring robust benchmarks in casual and word games.
Retention trends lowest overall in Africa and Asia. Worth noting, playtime runs the other way: Africa logs the highest average daily playtime even with low retention. This represents high engagement per returning user, but fewer returning users overall.
Across the commercially scaled titles we run, North America and Western Europe tend to anchor the highest retention, while Southeast Asia and LATAM often pair strong install volume with weaker long-term retention. A Southeast Asia-heavy title should not benchmark itself against North America-weighted averages. That comparison usually creates unrealistic expectations internally. If your player base is concentrated in a lower-retention region, your internal benchmark target should reflect that reality.
App Retention Benchmarks in Context: How Mobile Games Sit Within the Broader Mobile Market
Placing mobile games within the broader landscape of app performance helps teams determine whether they are dealing with a game-specific issue or a macro pattern across the mobile market. On D1 and D30, mobile games experience heavily accelerated decay curves compared to more utilitarian verticals like subscription, finance, or business apps.
A primary driver behind this dynamic is the notification ecosystem: mobile games’ profiles show they have among the lowest push notification opt-in rates of any app category. This narrows the organic re-engagement window significantly, making an optimized notification strategy disproportionately critical for retaining players compared to other mobile verticals.
Churn, Session Duration, and the Metrics That Sit Behind the Retention Rate
The retention rate tells you that something went wrong; these supporting metrics explain where and why:
1. Churn rate
Churn is simply the mathematical inverse of retention. Tracking churn separately matters because it quantifies the ongoing financial cost of player loss at scale and makes the business impact of a retention gap concrete. Small changes in churn compound aggressively across large cohorts, quickly turning into an expensive drain on capital.
2. Session frequency versus session depth
These metrics are often confused, but they reflect entirely different player behaviors and are not interchangeable. Frequency reflects habit formation (how often a player opens the game). Session duration reflects engagement depth (how long they stay). You need both to understand the quality of long-term monetization.
A player opening the game daily for two minutes behaves very differently from a player returning every few days for forty-minute sessions. They can produce identical D7 retention numbers but represent completely different monetization profiles and long-term LTV trajectories. For context, GameAnalytics put median daily playtime at around 22 minutes and the average player at roughly 4 sessions a day, with mid-core titles running the highest session counts at 6 to 7 per day.
3. Cohort analysis
Cohort analysis remains one of the most valuable diagnostic tools available. Breaking retention down by acquisition source, geography, and campaign separates user acquisition quality from product quality.
- Healthy organic retention paired with weak paid retention points directly toward targeting or acquisition quality problems.
- Weak retention across all cohorts (including organic) points toward fundamental flaws inside the product itself.
Those are completely different fixes.
4. Channel quality and payer retention
Two cohorts with identical D7 retention numbers can still represent completely different business quality depending on where the users came from.
- Rewarded and SDK Networks (e.g., Unity, AppLovin): These serve players inside other games through opt-in rewarded video and offerwalls. The audience is already highly engaged with mobile games, making these channels scale well for casual and hybrid-casual. Unity’s data shows games using rewarded formats saw a 4-percentage-point lift in D7 retention and a 2-point lift in D30. However, the watch-out is that incentivized installs can artificially inflate early retention while underdelivering on D30 and payer quality.
- Social Networks (e.g., Meta, TikTok): They offer the broadest reach and remain the backbone of LTV-based scaling. The social map shifted hard recently: Sensor Tower has Meta consolidating to more than 69% of social gaming impression share, up from around 54%, while TikTok nearly halved from 21.0% to 12.7%. Costs are climbing too, with CPIs up 15% to 20% year over year on both platforms. Format nuances dictate that creative does the heavy lifting: TikTok in-feed CTR sits at 0.8% to 2.5%, Meta feed at 0.5% to 1.5%, and Apple Search Ads at 5% to 15% due to high intent.
This is why blended retention dashboards are dangerous. Healthy organic cohorts can hide weak paid traffic, and strong Meta cohorts can mask underperforming rewarded networks. A healthy paid source should retain within roughly 10% to 15% of your organic baseline; segment retention by source, never read it off a blended average.
Furthermore, for an IAP-driven game, counting every returning user as one equal unit is a dangerous simplification. Whales make up only about 1% to 2% of the player base, yet they typically drive 50% to 70% of total revenue from in-app purchases. For genres like mid-core, RPG, and social casino, that concentration is the business. Their spend accumulates over time, with the typical whale transaction around $20 and more than half never making a single purchase above $50. This business model depends entirely on those players staying.
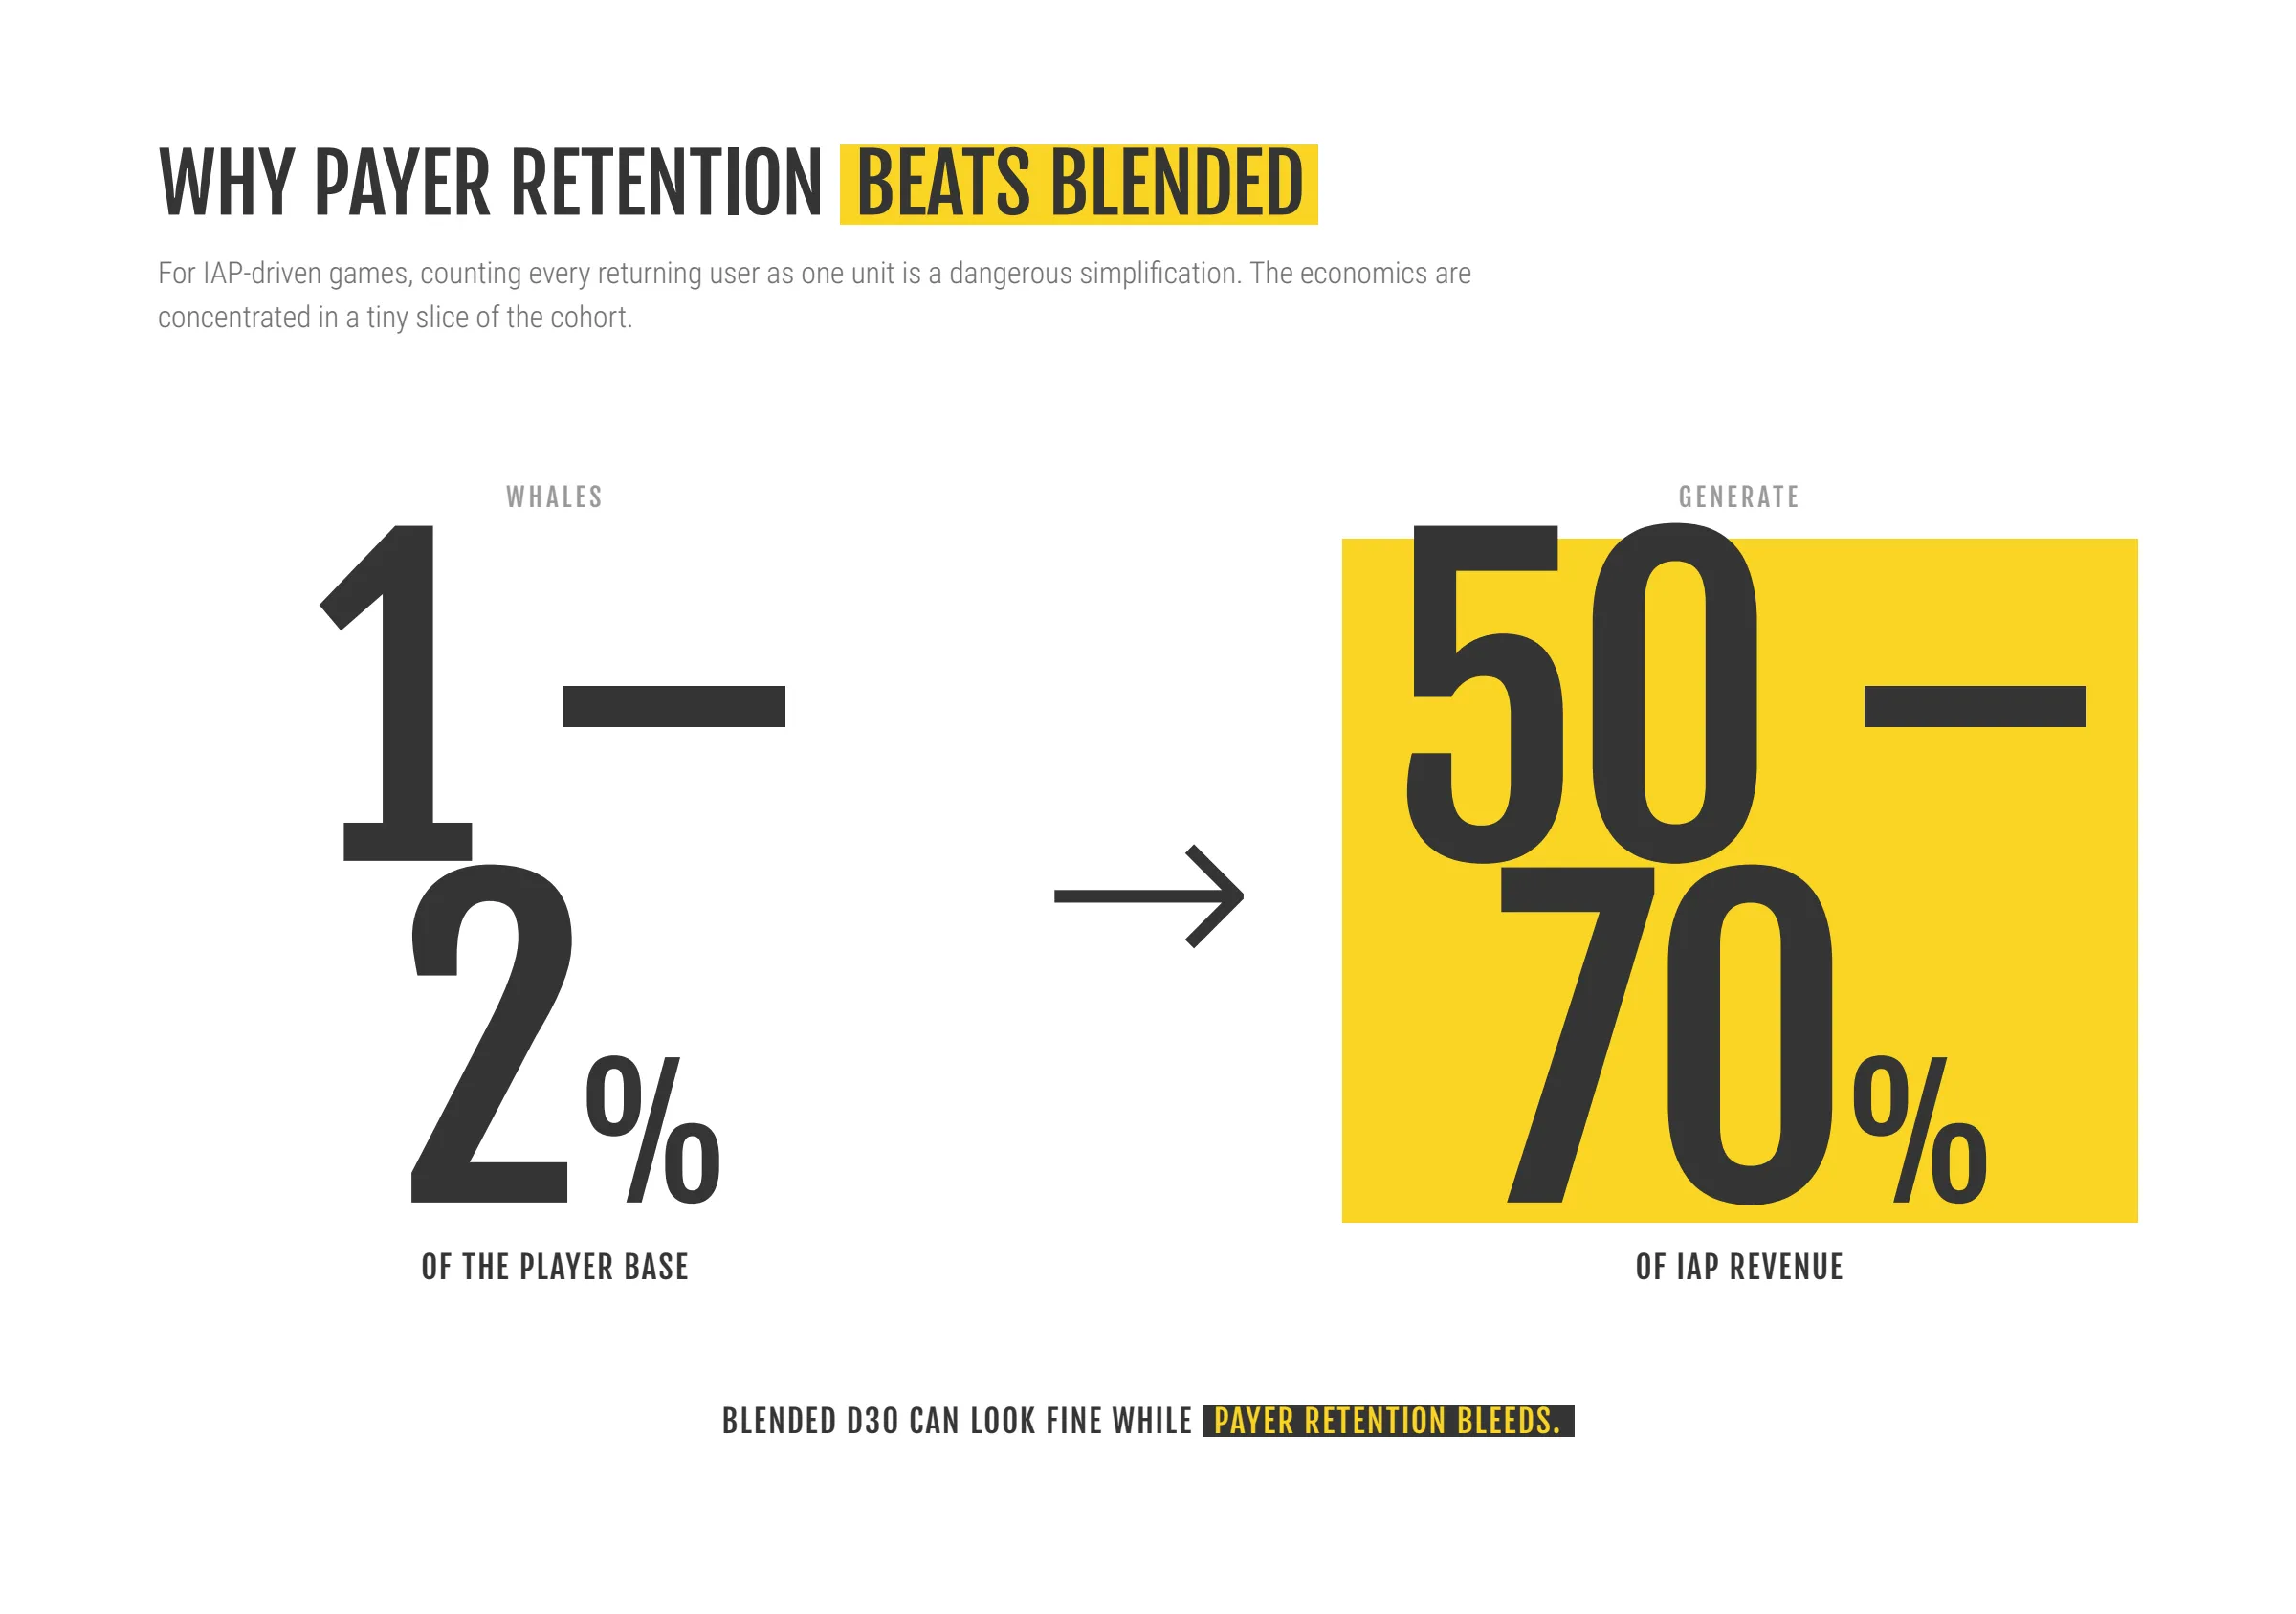
Blended D30 can look fine while payer retention is bleeding. Track payer retention, payer conversion rate, and ARPPU as their own independent series. A cohort that holds its non-payers but loses its early spenders is a cohort in deep trouble.
Where Retention Usually Breaks
Diagnosing the problem correctly is half the work. Here is the framework we typically use internally:
1. Weak D1 retention
Usually an onboarding or expectation problem. Typical causes include:
- Misleading creatives that mismatch player expectations.
- Slow onboarding loops or poor first-session pacing.
- Heavy-handed tutorials that over-explain instead of teaching through active play.
2. Weak D7 retention
Usually a habit-formation problem. Typical causes include:
- Weak progression pacing and poor reward structures.
- No compelling, mechanical reason to return after the first few sessions.
- Core gameplay novelty fading too quickly.
3. Weak D30 retention
Usually a content and economy depth problem. Typical causes include:
- Weak live ops infrastructure or shallow progression systems.
- Insufficient content deployment cadence.
- Missing social hooks or a poorly balanced long-term virtual economy.
Different retention intervals require fundamentally different solutions; treating all retention problems the same is one of the easiest ways to waste a fiscal quarter.
Measuring Retention is Harder Than it Used to Be
Every benchmark assumes underlying measurement is perfectly reliable, but on iOS especially, that assumption has weakened. Apple skipped SKAN 5.0 entirely and replaced SKAdNetwork with AdAttributionKit, which gained major capabilities in iOS 18.4. Concurrently, global ATT opt-in has fallen as low as 14%, meaning much of the ecosystem now relies on aggregated, modeled attribution rather than deterministic user-level tracking.
On Android, the expected privacy upheaval did not happen: Google formally killed its Privacy Sandbox initiative in October 2025, and the advertising ID still works with no confirmed deprecation date.
Most modern MMP dashboards combine SKAN/AdAttributionKit postbacks, modeled network data, first-party analytics, and blended revenue reporting. This creates useful directional visibility, but it is not perfect truth. MMPs have shifted from being pure attribution engines to reporting layers displaying what ad networks send them; modeled sources like Meta’s AEM tend to run inflated against SKAN.
Because SKAN and AdAttributionKit suppress data for campaigns under roughly 20 daily installs due to privacy thresholds, best practice is to aim for 100 to 150 installs per campaign per day to secure usable postbacks. This is why incrementality testing matters more than ever—it answers whether an install would have happened anyway without the ad. The teams scaling profitably today optimize toward down-funnel events tied to retention quality rather than chasing raw, top-funnel installs alone.
What This Means Depending on Your Role
The same retention data means entirely different things depending on your seat in the organization:
- For CEOs and Founders: The headline is long-term business sustainability. Focus on the LTV-to-CAC ratio, tracking real payback windows, and checking the spend-to-revenue gap of the category you are backing. Ensure your product’s monetization depth lets you survive live auctions against deeper-pocketed competitors. Strong retention gives businesses room to compete harder in auctions and survive rising acquisition costs.
- For Product Teams: Retention is your clearest scoreboard. D1 reflects onboarding quality, D7 reflects habit loops, and D30 reflects product depth, live ops, and long-term progression. For IAP-heavy games especially, payer retention curves matter far more than your blended headline retention rate.
- For UA Teams: The core mission is measurement discipline and cohort quality. Benchmark acquisition channels entirely separately, evaluate paid retention against organic baselines, and never scale marketing budgets solely on early ROAS signals without mapping the long-term retention curves underneath them.
Know Your Numbers and Then Put Them to Work with AppAgent
Benchmarks are only useful if they change decisions. At AppAgent, retention work connects directly into mobile growth strategy, paid user acquisition, creative production, and product optimization (including paywall and onboarding flows). We link every strategic vertical directly to the concrete retention levers your product requires.
In the BELLEMINT case study, that full-system approach helped deliver a +29% uplift in Day 7 retention on paid channels and a 45% YoY increase in ROAS by connecting creative testing, down-funnel optimization, channel expansion, and the in-game experience.
Our approach is entirely data-driven and hands-on, not generic consulting. UA determines which users enter the funnel, creative determines whether user expectations match reality, and product optimization combined with live ops determines whether players stay long enough for the cohort economics to actually function.
The teams that scale sustainably are rarely the ones with the cheapest installs. They are the teams whose retention curves support the business months after the initial install happens. If your numbers are not where they need to be, the work starts with finding exactly where the structural gap sits and why. That is the conversation worth having.
If you are ready to stop the cash drain and optimize your game’s economics, Let’s Talk.