Three weeks ago, I had the privilege of joining a panel on “LTV for Mobile Apps” at PGC Helsinki, hosted by Mika Levo of Pollen VC. It quickly became clear that calculating and leveraging Lifetime Value (LTV) is more complex—and more critical—than ever for freemium games.
With evolving privacy regulations, sophisticated UA strategies, and the ever-rising cost of acquiring quality users, every percentage point of improvement in LTV can make or break your game’s profitability.
In this guide, I’ll share the most up-to-date best practices for modeling, optimizing, and leveraging LTV, drawn from my experiences and insights gathered from experts at Rovio, Miniclip, Wooga, Space Ape Games, Pixonic, and beyond.
WHAT IS LTV, AND WHY DOES IT MATTER?
Lifetime Value (LTV) measures the total net revenue you can expect from a player over their engagement with your game. Optimizing for LTV is the north star for freemium game studios and is essential for:
Maximizing user acquisition ROI: Knowing how much you can afford to pay for a new user.
Scaling paid campaigns safely: Confidently investing in channels that produce positive returns.
Guiding product and monetization decisions: Prioritizing features and events that boost retention and spend.
Navigating privacy changes: Making smarter UA decisions in the era of SKAN and ATT.
LTV Calculation Methodology
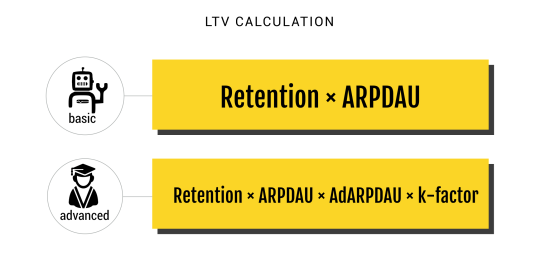
The basic formula for LTV calculation is “Lifetime × Average Revenue per Daily Active User (ARPDAU)”.
Lifetime is essentially the number of active days calculated from retention. You do this by using a power function once you have a few data points like D1, D3, D7, and D30.

The devil is in the details, though. Here are a few best practices to keep in mind when calculating your LTV:
Segment by platform, country, and channel: Calculate LTV separately for iOS, Android, and key geos. Also, distinguish organic, paid, and influencer-driven installs—this granularity is vital for campaign optimization.
Choose your terminal point carefully: Decide on your terminal point, which is essentially how far into the future you are looking when calculating your LTV. Some companies opt for a short period like 90 days, while others extend to 365 days. This decision can depend on factors such as the game genre (casual games usually have a shorter lifecycle, except for exceptions like Candy Crush) and your strategy (how long you are willing to wait for recouping).
Incorporate all revenue streams: Besides in-game revenue, consider monetization through ads. Keep in mind that not every region generates the same eCPM (essentially, the revenue per view). A basic approach is to calculate a single coefficient – a multiplier of in-app revenue. However, for more precision, analyze the ratio between in-app and ad revenue per platform and country. It’s common to receive 10-20% of revenue from ads, which might alter your profitability equation if you don’t sufficiently detail this revenue stream.
Predictive LTV and early modeling: One significant evolution in LTV modeling is the adoption of predictive analytics. Modern studios increasingly forecast LTV using early signals (such as D1/D3 retention, first purchase, and tutorial completion) combined with machine learning models. This approach enables UA teams to make faster decisions, optimizing campaigns based on projected LTVs rather than waiting months for actual data to accrue. If you’re not leveraging predictive LTV modeling, you risk missing out on crucial optimization windows and falling behind competitors who move faster.
Here comes the fun part: Virality
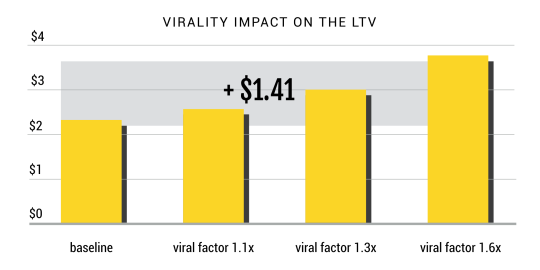
Virality is an aspect where companies differ significantly. Surprisingly, even large publishers often lack systems to analyze the so-called K-factor (an industry term for virality).
Neglecting virality in your LTV formula might result in an overly cautious approach to User Acquisition (UA), potentially limiting the scalability of your mobile business.
Here are four approaches to virality I’ve observed among developers:
- Ignoring virality: The safest but most conservative method that can limit UA scale.
- Treating non-paid traffic as viral: The simplest but least accurate approach, as not all organic traffic is viral.
- Accounting for organic traffic spillover from paid installs: A still simple method that effectively attributes virality to acquisition.
- Using multiple ‘K-factors’ for in-game virality, features, chart impacts, etc.: The most complex method, requiring extensive data collected over time. This yields the most precise LTV estimates.
The choice of methodology depends on three factors:
A. Business Intelligence (BI) sophistication
B. Management’s tolerance for risk
C. Your company’s overall approach to UA
I personally favor a more conservative approach, considering virality only from paid traffic (as per the third approach above). This involves analyzing the baseline of organic users without paid acquisition.
Then, observe the increase in the ratio of daily active users to new installs during the paid campaign. The difference can be attributed to the effect of paid installs and used to refine your LTV calculation.
Let’s take a look at an example:
In the past 30 days, this game had a ratio between Daily Active Users (DAUs) and new installs of 9%, during which no campaign was running.
You start a paid campaign in a selected territory and analyze the change in the ratio. For instance, it could now be 14%, meaning your paid campaign has attracted 5% more viral users.
Your K-factor is 1.05, and you can now multiply your LTV by this coefficient.
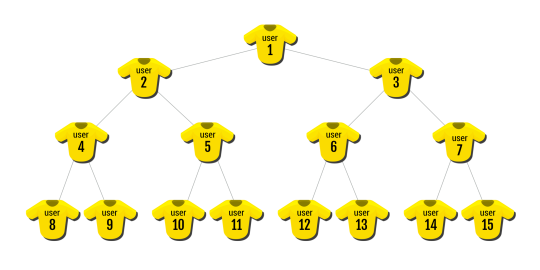
I’m inclined to use recursive virality, which involves counting users who were brought in by other viral users. Imagine this as a pyramid where one user attracts another, who then attracts another, and so on. It’s up to you how many “levels” you include, but I suggest sticking to three, as including more often leads to chasing numbers rather than providing a realistic description.
The approach described above is relatively basic, but it serves as a good starting point for most companies. The more data you accumulate and the more skilled the data scientists involved in LTV calculations, the more granular your viral factor should become.
The most sophisticated companies, such as Miniclip, leverage years of data, which enables them to distinguish between multiple types of virality. As a result, they have developed more precise models for various scenarios and lifecycles of their games.
Segmenting LTV for Deeper Insights
A key area where successful studios excel is in granular LTV segmentation.
Instead of relying on one LTV number, break it down by acquisition channel, region, payer status (whales, dolphins, non-payers), and in-game behavior patterns.
For example, your Facebook-acquired users in Tier 1 countries may have double the LTV of organic users in Tier 3 regions.
Analyzing LTV by cohort enables targeted UA scaling and personalized monetization strategies.
Also, consider segmenting by in-game progression, as advanced players may monetize differently and respond better to certain live ops or offers.
LTV Alone is Bullshit
You’ve likely noticed claims about high LTV, such as $3.40, $4.70, or $7.20. However, these figures are often meaningless because a high LTV for a casual game in Romania might be low for a mid-core game in Australia. A high LTV doesn’t necessarily imply:
- Profitable acquisition: Even if the acquisition is profitable, it doesn’t guarantee overall effectiveness. High Cost Per Install (CPI) might reduce the profit margin.
- Efficient spending: High CPI could indicate that spending is not as effective as it could be, impacting profit margins.
- Overall company profitability: A high LTV doesn’t confirm if the company is breaking even or profitable overall.
What truly matters is the profit remaining after accounting for all costs, including price per install, company running costs, product development costs, taxes, etc. For profit calculations, consider the following points:
Discuss target ROI with management: Companies not including virality in their LTV estimates might aim for only an 80% Return on Investment (ROI), relying on the remaining 20%+ of revenue from organic sources. Some publishers aim for a 100% ROI, viewing organics as the profit source covering development and other studio running costs. Others target a 140% ROI, including virality, to ensure profitability after all development and marketing costs.
Granularity in ROI calculations: The more detailed your ROI calculations are (by platform, country, ad network, campaign), the higher your profitability will be. Automation of data analysis is key here. Start by aggregating your data into a Google Spreadsheet from your attribution partner and manually working with the data. Even a simple setup like this can put you ahead of 90% of other companies in the mobile space.
Define revenue calculation methods: Decide how to calculate revenue, whether it’s gross, net, or net after taxes. It’s important to clarify this with your management team and CFO.
LTV BENCHMARKs and payback perıods
For context, in 2024, casual games in Tier 1 markets may see D180 LTVs in the $1.80–$2.50 range, while mid-core titles might hit $4–$6 or more.
But benchmarks are only helpful if compared cohort-to-cohort.
Additionally, understanding your payback period—how long it takes to recoup UA costs from player revenue—is critical.
Many UA managers today focus on D7, D14, and D30 payback as leading indicators, not just final LTV.
If you can recoup 50% of your spend in the first 15 days, you’ll have a healthier cashflow and the flexibility to reinvest in new campaigns.
LTV Recoup
The final, but equally important aspect of working with LTV focuses on recoup. Basically, LTV is a value at the end of your terminal point, for example at day 180. Obviously, players spend their money throughout their lifecycle and you as a developer accumulate the revenue over time.
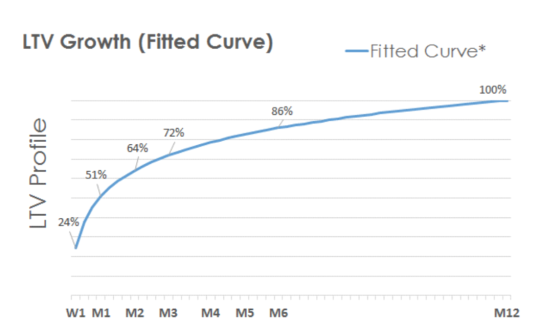
Every game attracts users through different acquisition channels, leading to varied LTV recoup rates. This is crucial for two reasons:
-
Understanding cash flow timing: Knowing when you will receive revenue is vital. If you recoup 50% of the revenue in the first 15 days, Apple and Google will pay your share sooner compared to a game that monetizes after weeks of free gameplay. With increasing User Acquisition (UA) budgets, cash flow becomes a critical factor that can either slow down or halt your traction.
-
Quick evaluation by UA managers: UA managers can’t afford to wait 90, 180, or even 360 days to assess the profitability of campaigns. Understanding the LTV curve enables quicker evaluation of the monetization potential of traffic. For instance, companies like Rovio can determine within just 3-4 days whether to continue or stop a specific campaign. Metrics like revenue recoup rates, number of payers, and several post-install indicators are essential for effective, performance-based mobile marketing.
LTV Modeling in a Privacy-First World
Since Apple’s ATT and Google’s Privacy Sandbox, tracking user-level LTV is more challenging.
Smart studios have adapted by focusing on aggregate cohort-level modeling—grouping users by channel, geo, and time, and tracking blended LTV using SKAN or privacy-compliant attribution tools.
Early post-install signals (like ad engagement or first purchases) are even more important for predicting future LTV. If you’re not already, start collecting these signals for every campaign to improve your model accuracy under new privacy constraints.
Final Thoughts
Your lifetime value calculation and daily usage statistics are critical metrics and form the foundation of a free-to-play business.
The aim of this post is to illuminate key aspects of LTV that are often overlooked in conferences, possibly due to their complexity or because companies are protective of their know-how. I hope my research, testing, and interviews with leading minds in our industry have inspired you to rethink how you calculate your LTV.
If you’re just starting, build your LTV models with as much segmentation as your data allows.
Test predictive modeling for early decision-making, and make sure you’re factoring in all sources of monetization—especially ad revenue.
Stay updated on privacy changes, and adapt your analytics stack to support aggregated and modeled LTV wherever possible.
Looking for a hands-on resource? Download our free LTV Calculator Template for mobile games—optimized for privacy-safe, modern data workflows.